Tendances en matière de logistique et de transport mondial pour le T3 2026

Août 2026 – Mise à jour pour le T3 : nos professionnels du secteur ont compilé les tendances du fret et de la logistique ainsi que les actualités du marché pour 2026 afin d’aider votre entreprise à se préparer pour l’avenir.
Tendances macroéconomiques mondiales
La baisse des prix des matières premières en juillet a atténué les pressions inflationnistes, mais les perturbations persistantes au Moyen-Orient demeurent le principal moteur de l’incertitude économique et financière à court terme.
Sommaire des indicateurs macroéconomiques clés
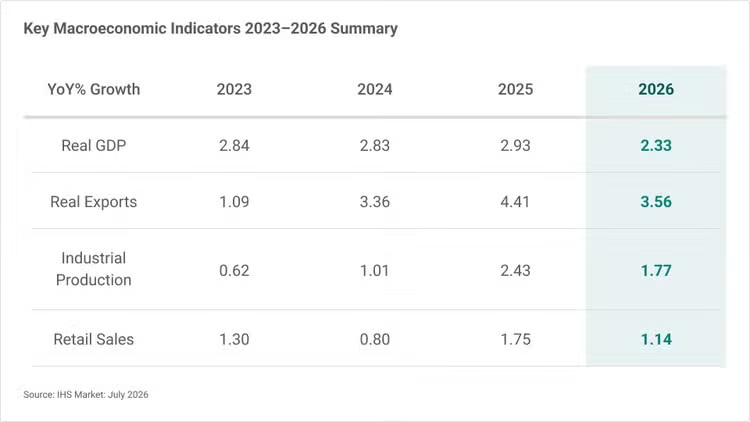
Sommaire des indicateurs macroéconomiques clés
- Les projections d’exportations réelles ont été révisées à la hausse à 3,56 % à l’échelle mondiale, sous l’effet d’augmentations importantes des projections pour l’Asie-Pacifique et les États-Unis.
- Les prévisions de production industrielle ont légèrement reculé à 1,77 %, avec des baisses importantes dans la région du Moyen-Orient.
- Les prévisions de ventes au détail ont été abaissées à 1,14 % par rapport aux projections de avril 2026, en raison de baisses en Chine et dans l’ensemble de la région Asie-Pacifique.
Source : IHS Markit : juillet 2026
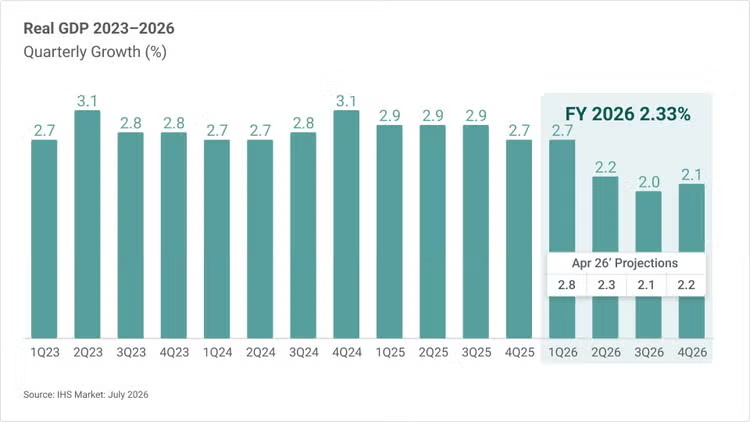
Croissance trimestrielle du PIB réel de 2023 à 2026
Croissance trimestrielle du PIB réel de 2023 à 2026
Prévisions du PIB réel en 2026
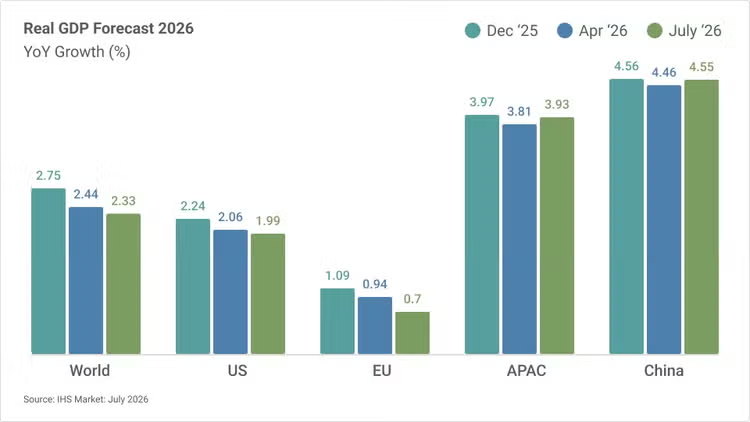
Prévisions du PIB réel en 2026
- Les prévisions de croissance du PIB mondial pour 2026 ont diminué par rapport à avril 2026, les projections de juillet étant en baisse dans les principales régions des pays occidentaux, mais en hausse dans la région Asie-Pacifique, pour une croissance mondiale de 2,33 %.
Indice PMI manufacturier par marché
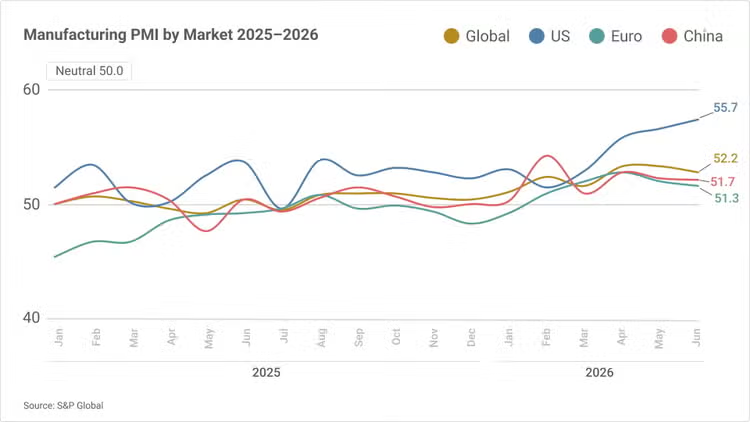
Indice PMI manufacturier par marché
- L’indice PMI manufacturier mondial a reculé à 52,2 en juin, le rythme de croissance ayant ralenti pendant deux mois consécutifs. Il demeure toutefois en phase d’expansion, au-dessus du seuil neutre.
- L’indice PMI manufacturier de la Chine a légèrement reculé à 51,7 en juin, demeurant au-dessus du seuil neutre de 50,0, ce qui indique une expansion de l’activité manufacturière.
- L’indice PMI manufacturier des États-Unis a augmenté à 55,7 en juin, contre 55,1 en mai, ce qui témoigne d’une croissance de l’activité.
- L’indice PMI de la zone euro a légèrement reculé à 51,3 en juin, par rapport à 51,6 en mai.
Source : S&P Global
Taux d’inflation trimestriel de l’IPC
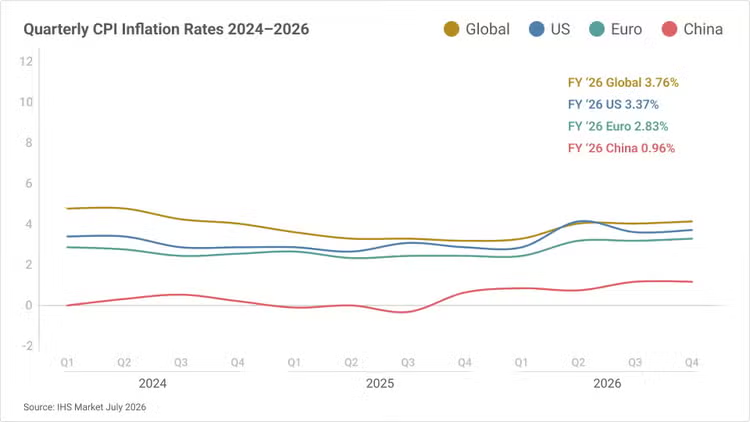
Taux d’inflation trimestriel de l’IPC
- L’IPC mondial prévu pour 2026 a augmenté par rapport aux projections précédentes d’avril et demeure supérieur aux projections antérieures au conflit.
- Le taux d’inflation aux États-Unis a légèrement diminué par rapport aux projections d’avril pour s’établir à 3,37 % pour l’année, principalement en raison de la baisse des prix du pétrole.
- Les prévisions d’inflation dans la zone euro ont été révisées à la baisse à 2,83 % en juillet, principalement en raison d’hypothèses de prix de l’énergie moins élevés.
- La projection d’inflation de la Chine a été révisée à la hausse à 0,96 % en juillet, contre 0,85 % en avril.
Source : ISH Markit

Mise à jour sur l’industrie du fret aérien
La demande mondiale de fret aérien augmente, les expéditions liées à l’IA et aux technologies remplaçant le commerce électronique comme principal moteur, tandis que la capacité se reconstitue.
Demande pour le fret aérien par rapport à la capacité
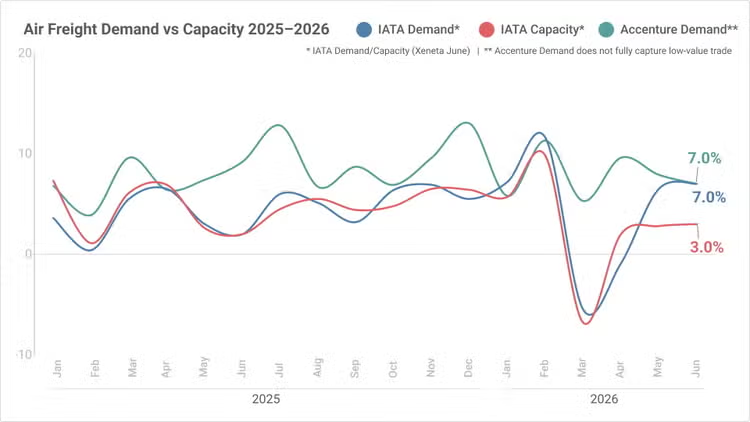
Demande pour le fret aérien par rapport à la capacité
- La demande a augmenté de 7,0 % sur 12 mois en juin, contre une hausse de 4,0 % sur 12 mois enregistrée en mai.
- Les expéditions liées à l’intelligence artificielle, aux centres de données et aux semi-conducteurs ont constitué le principal moteur des volumes sur la plupart des corridors transpacifiques et ont contribué de façon importante à la croissance de la demande.
- La croissance de la capacité a légèrement augmenté à 3,0 % sur 12 mois en juin, contre 1,0 % en mai, ce qui a exercé une pression à la baisse sur les tarifs spot mondiaux, qui ont diminué de 38 % sur 12 mois en juin, après une hausse de 41 % enregistrée en mai.
* Demande/capacité IATA (Xeneta, juin)
** La demande d’Accenture ne rend pas entièrement compte du commerce de faible valeur
Sources : Accenture Cargo, IATA, Xeneta
Tarifs de l’industrie du fret aérien
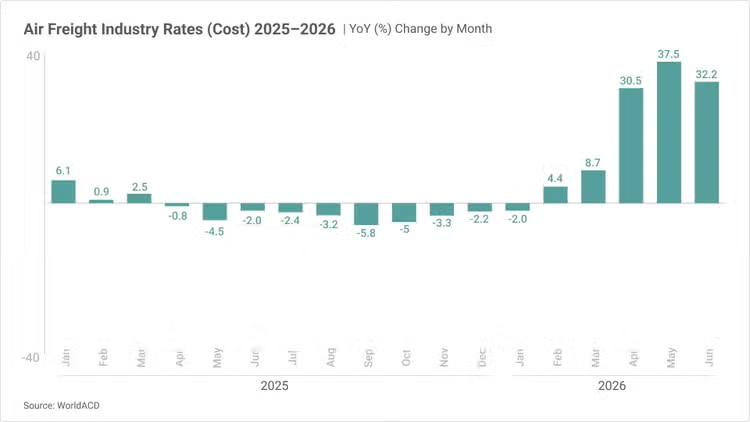
Tarifs de l’industrie du fret aérien
- Les tarifs aériens mondiaux moyens, qui combinent les tarifs spot et les tarifs contractuels, ont légèrement diminué à +32,2 % sur 12 mois en juin, contre +37,5 % en mai, en raison de la baisse du coût du carburéacteur et du retour de capacité.1
- Les tarifs à destination de la région du Golfe commencent à s’assouplir après la forte hausse de la demande liée à l’IA, même si les tarifs au départ de l’Asie du Sud-Est (+46 %), de l’Asie du Sud (+88 %) et de l’Europe (+79 %) demeurent élevés par rapport à la période précédant le début de la crise.2
- Les prix du carburéacteur ont diminué de 22,8 % d’un mois à l’autre en juin, sous l’effet des fragiles négociations liées à la crise au Moyen-Orient.3
Tendances de l’industrie du fret aérien
L’atténuation de l’inflation soutient la croissance à court terme, même si les tensions au Moyen-Orient demeurent une importante source d’incertitude macroéconomique.
- La demande mondiale de fret aérien a augmenté de 12,6 % sur 12 mois au T2 2026, les volumes de juin ayant progressé de 7,0 % sur 12 mois.1
- La demande mondiale liée aux semi-conducteurs et à l’IA a plus que doublé sur 12 mois en avril, les ventes ayant augmenté de 106 %, principalement sous l’effet de la croissance sur les corridors transpacifiques, malgré une baisse de la demande entre la Chine et les États-Unis attribuable aux restrictions tarifaires.1
- Alors que la demande liée à l’IA continuait de soutenir le secteur du fret aérien, la demande du commerce électronique a diminué de 7 % sur 12 mois en mai 2026, marquant un sixième mois consécutif de contraction.1
- Jusqu’en mai 2026, la demande a augmenté dans toutes les régions sauf au Moyen-Orient (-12,8 %).2
Implications : La forte demande liée aux semi-conducteurs et à l’IA, principal moteur de la croissance du fret aérien au T2 2026, devrait se poursuivre au T3, les corridors transpacifiques demeurant le principal marché de croissance.
Sources : 1) Xenata, 2) IATA
- La capacité mondiale de fret aérien a augmenté de 7,8 % sur 12 mois au T2 2026, la capacité de juin ayant progressé de 3,0 % sur 12 mois, alors qu’elle continuait de se rétablir à la suite du fragile cessez-le-feu au Moyen-Orient.1
- Dans l’ensemble, la capacité a augmenté de 0,7 % au cours du T2 2026. Bien que les baisses sur les marchés du Moyen-Orient se soient atténuées, certains corridors clés sont demeurés sous les niveaux de l’année précédente, notamment UE→MESA (-9,7 %), MESA→UE (-6,8 %), MESA→APAC (-3,7 %) et APAC→MESA (-3,0 %).3
- La capacité en soute des gros-porteurs a diminué de 4,2 %, tandis que la capacité des avions-cargos a augmenté de 4,3 % au T2 2026, en raison d’une réduction de la capacité en soute chez les transporteurs du Moyen-Orient.3
- Les tarifs mondiaux du fret aérien ont augmenté en moyenne de 33,4 % sur 12 mois au T2 2026, dont 32,2 % en juin, 37,5 % en mai et 30,5 % en avril.4
Incidences : les prix du pétrole brut Brent ont rebondi de près de 20 % depuis le début de juillet, tandis que le trafic dans le détroit d’Ormuz est au point mort. Les tensions géopolitiques au Moyen-Orient devraient demeurer le principal facteur influençant les tarifs du fret aérien et la dynamique du marché à court terme.
Sources : 1) Xenata, 3) Accenture Cargo, 4) WorldACD
- La croissance mondiale demeure fragile, avec un ralentissement de la dynamique économique dans la plupart des grandes économies, notamment aux États-Unis, en Chine et en Inde, malgré une légère amélioration des récents indicateurs d’activité.
- L’évolution de la situation au Moyen-Orient demeure le principal facteur d’incertitude pour l’économie mondiale, alimentant la volatilité des prix de l’énergie, des anticipations d’inflation et des perspectives de politique monétaire.
- La baisse des prix des matières premières a amélioré les perspectives à court terme, soutenant des prévisions d’inflation plus faibles et des perspectives de croissance légèrement meilleures pour de nombreuses économies importatrices nettes de pétrole.
Les taux d’intérêt devraient demeurer élevés plus longtemps, les banques centrales devant composer avec l’atténuation des pressions inflationnistes, les risques géopolitiques persistants et le regain de volatilité des prix du pétrole.
Implications : La modération de l’inflation pourrait contribuer à stabiliser les dépenses des entreprises et le réapprovisionnement des stocks, favorisant ainsi les flux commerciaux internationaux. La demande de fret aérien devrait demeurer résiliente, même si les tensions géopolitiques et la volatilité des prix du carburant pourraient alimenter l’incertitude du marché à court terme.
Source : IHS Markit
Aperçu du fret aérien nord-américain
Le carburant entraîne une hausse des dépenses de transport alors que le conflit entre les États-Unis et l’Iran intensifie les coûts énergétiques.
Indice des expéditions Cass Freight 2025-2026
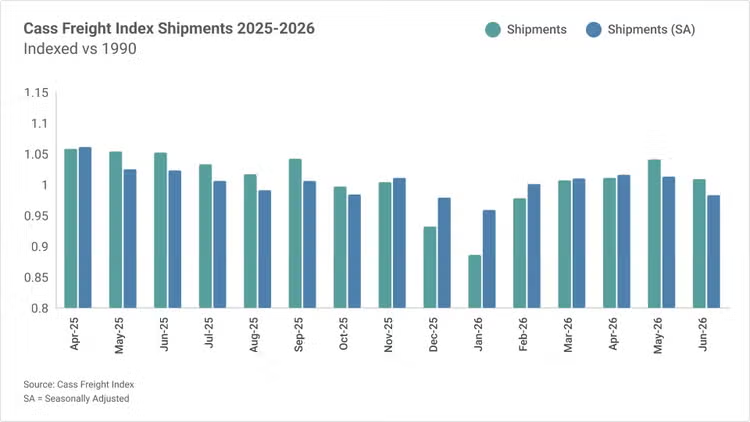
Indice des expéditions Cass Freight 2025-2026
- L’indice Cass Freight Index a fait état d’une hausse des dépenses de 11,2 % sur 12 mois en juin, tandis que les expéditions ont diminué de 3,1 % d’un mois à l’autre et de 4,1 % sur 12 mois.
- Les volumes sont en baisse en raison de la diminution de la capacité, et les prix du carburant influent également sur la demande de biens.
Source : Cass Freight Index
Indice des directeurs d’achats
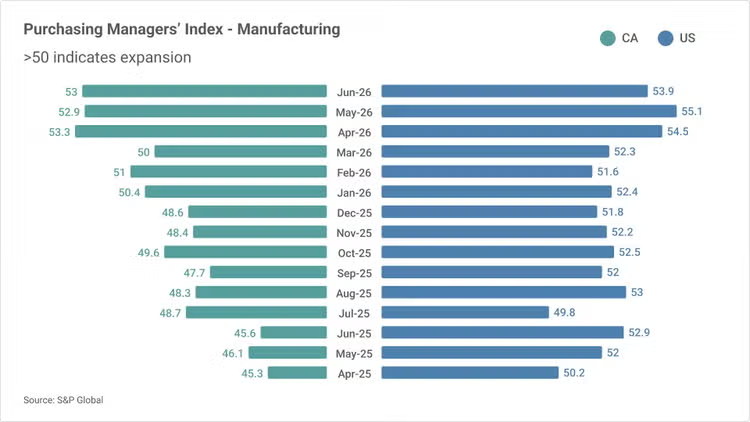
Indice des directeurs d’achats
- Selon le récent rapport de S&P Global Market Intelligence, la croissance du secteur manufacturier américain se poursuit malgré une nouvelle baisse de l’emploi et de la confiance des entreprises.
- Certains fabricants signalent une augmentation des stocks par mesure de précaution contre de futures hausses de prix ou pénuries d’approvisionnement, ce qui souligne les préoccupations croissantes quant aux répercussions que la guerre pourrait avoir sur les usines dans les semaines à venir.
- Les entreprises sont demeurées optimistes quant aux perspectives de production pour les prochains mois, mais le degré global d’optimisme a chuté à son plus bas niveau en huit mois.
- Le sentiment positif était lié à l’espoir qu’un recul des pressions inflationnistes et des tensions géopolitiques contribue à stimuler les ventes et la production. Toutefois, les préoccupations concernant la santé de l’économie américaine ont continué de peser sur la confiance des entreprises.
Source : S&P Global
Tendances pour l’industrie du fret aérien en Amérique du Nord
Les tensions géopolitiques et les facteurs macroéconomiques suscitent des préoccupations pour les chaînes d’approvisionnement
- Les États-Unis ont refusé de renouveler l’ACEUM, ce qui plonge l’accord dans l’incertitude et entraîne des examens annuels continus plutôt qu’un examen tous les six ans.1
- Le passage à des examens annuels de l’ACEUM, qui régit environ 2 T$ US de biens et services par année entre les États-Unis, le Mexique et le Canada, accroît le risque de nuire aux entreprises qui en dépendent et pourrait limiter les investissements en Amérique du Nord.2
Implications : L’incertitude entourant l’ACEUM pourrait accroître la complexité des chaînes d’approvisionnement en Amérique du Nord, stimulant la demande de solutions de transport efficaces offertes par des transitaires expérimentés.
Sources : 1) Yahoofinance, 2) The Guardian
- Une stabilisation à court terme du marché américain du transport LTL pourrait ne pas se produire d’ici la fin de l’année, alors que les contraintes de capacité et les hausses tarifaires se répercutent sur l’ensemble de la chaîne d’approvisionnement dans un marché extrêmement tendu.3
- Les incertitudes liées aux tarifs douaniers, les perturbations d’approvisionnement et les mesures incitant à la relocalisation de la production poussent les constructeurs automobiles à revoir leurs stratégies de production en Amérique du Nord.4
- Plus de 55 % des véhicules vendus aujourd’hui aux États-Unis y sont fabriqués, et cette tendance devrait s’accentuer au cours des prochaines années, soutenue par l’expansion des FEO et la localisation des chaînes d’approvisionnement.4
Implications : Alors que les marchés LTL se resserrent et que la fabrication nord-américaine continue de se localiser, les expéditeurs ont besoin de solutions de transport qui offrent souplesse et résilience des chaînes d’approvisionnement afin d’atténuer les contraintes de capacité et d’optimiser leurs chaînes d’approvisionnement.
Sources : 3) S&P Global, 4) PWC
- Le Bureau of Labor Statistics (BLS) des États-Unis a indiqué que l’inflation avait augmenté de 3,5 % sur 12 mois malgré une baisse de 5,7 % des prix de l’énergie attribuable à une pause dans le conflit entre les États-Unis et l’Iran, mais les risques inflationnistes pourraient réapparaître au cours des prochains mois dans un contexte de regain des tensions entre les deux pays.5
- L’indice PMI manufacturier du Mexique publié par S&P Global a augmenté de 3,4 % d’un mois à l’autre pour atteindre 51,3 en juin 2026, démontrant une amélioration des conditions d’exploitation. Pour l’avenir, les fabricants demeurent optimistes, la confiance des entreprises ayant atteint son plus haut niveau en trois mois.6
- La Réserve fédérale devrait relever les taux d’intérêt en septembre après avoir publié une déclaration selon laquelle le Federal Open Market Committee, chargé de fixer les taux, « assurera la stabilité des prix » afin de se rapprocher de son taux d’emprunt de 2 %.7
Implications : L’amélioration de l’activité manufacturière au Mexique et l’incertitude persistante dans les chaînes d’approvisionnement poussent les entreprises à privilégier les coûts de fret dans le cadre d’une stratégie transfrontalière fiable.
Sources : 5) BLS, 6) Trading Economics, 7) CNBC

Mise à jour sur l’industrie du fret maritime
Le pic du début du T2 a fait augmenter les volumes et les tarifs. Au T3, la croissance générale des échanges demeure positive, tandis que la dynamique des importations américaines devrait ralentir. La capacité effective demeure limitée, de sorte que les conditions tarifaires continuent de varier selon le corridor commercial.
Demande par rapport à la capacité
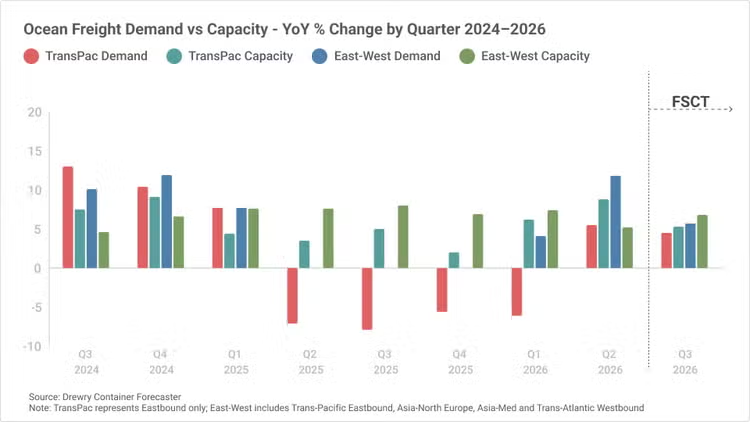
Demande par rapport à la capacité du fret maritime
- La demande au T3 demeure en hausse sur 12 mois selon les indicateurs généraux du commerce présentés. Le graphique montre une croissance continue de la demande transpacifique et Est-Ouest pendant le trimestre de prévision.1
- Les prévisions générales de Drewry concernant la demande transpacifique diffèrent des perspectives du JOC pour les importations américaines. Le JOC prévoit que les importations totales des États-Unis diminueront de 6,4 % sur 12 mois en juillet, de 8,6 % en août et de 2,2 % en septembre. Cet écart reflète des champs de données et des méthodes de prévision différents.2
- La croissance est inférieure au sommet atteint au T2. Cela ne signifie pas que les mesures de la demande présentées dans le graphique sont en contraction. Cela signifie que le taux de croissance sur 12 mois ralentit après la période plus vigoureuse du T2.1
- La capacité effective demeure plus limitée que ne le laisse croire la croissance nominale de la flotte. Les trajets plus longs, le repositionnement de l’équipement, le faible nombre de navires commercialement inactifs et les perturbations au Moyen-Orient continuent de réduire l’offre utilisable.3
- La capacité au T3 demeure liée à l’évolution des itinéraires. Drewry prévoit un retour graduel par Suez, tandis qu’Alphaliner a signalé des changements de service limités au début du T3.4
Sources : 1) Drewry, 2) JOC Quarterly Intelligence, 3) JOC Magazine, 4) Alphaliner Newsletter 27-2026
Tarifs
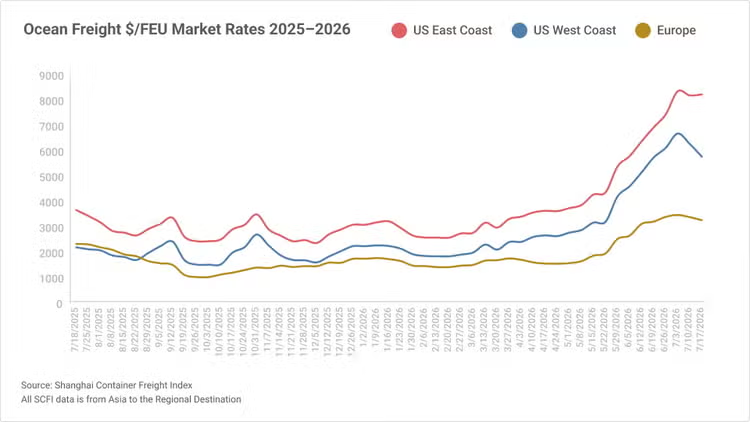
Tarifs
- Le T3 a commencé avec des tarifs supérieurs aux niveaux du début de 2026. Le graphique montre de fortes hausses au T2 sur les côtes Est et Ouest des États-Unis, suivies d’une certaine modération en juillet.
- L’environnement tarifaire du T3 reflète à la fois la demande et la capacité effective. Le JOC a attribué la hausse précédente à une demande plus forte à court terme, à des itinéraires plus longs, à la congestion portuaire et à l’augmentation du coût du carburant.
- Des tarifs plus élevés ne signifient pas que les conditions du marché sont identiques sur tous les corridors. Chaque série correspond à un corridor différent et, dans le cas de l’Europe, à une base de conteneur différente.
- Le JOC prévoit des perspectives plus faibles pour les importations américaines au T3. Les tarifs élevés en début de trimestre ne doivent donc pas être interprétés comme un signe de demande plus forte pendant l’ensemble du trimestre.
Source : JOC Quarterly Intelligence
Facteurs qui affectent le secteur du fret maritime
Les perturbations et l’allongement des itinéraires limitent la capacité effective tandis que la demande demeure inégale au 2e trimestre de 2026.
- Le JOC s’attend à ce que la vague actuelle d’importations ralentisse au cours du troisième trimestre. Les importations totales des États-Unis devraient diminuer de 6,4 % sur 12 mois en juillet, de 8,6 % en août et de 2,2 % en septembre.1
- Les importations de l’Asie vers les États-Unis ont augmenté de 19,5 % sur 12 mois en mai, après avoir diminué de 4,3 % au cours des quatre premiers mois de 2026.1
- Les données sur les réservations à terme sont demeurées solides jusqu’en juin, ce qui indique une demande soutenue à court terme sur le transpacifique.1
- La demande varie selon le corridor commercial. Les importations de l’Europe du Nord vers les États-Unis ont augmenté de 6,2 % sur 12 mois en mai, tandis que les importations en provenance de la Méditerranée ont augmenté de 22,8 %. Toutefois, les tarifs d’importation sont demeurés plus faibles que sur le transpacifique.1
Implications : La hausse de mai témoigne d’une vigueur à court terme, tandis que les perspectives pour le troisième trimestre demeurent plus faibles sur 12 mois. Les conditions peuvent varier selon le corridor commercial et le moment de l’expédition. Les expéditeurs devraient examiner leurs besoins de réservation selon le corridor et la période de départ.
Source : 1) JOC Quarterly Intelligence
- Les marchandises expédiées de façon anticipée, la réduction de la capacité disponible des navires et la hausse des coûts de soutage ont contribué à l’augmentation des tarifs spot transpacifiques à compter de la mi-mai.1
- Les transporteurs ont déployé environ 1,98 million d’EVP de capacité en juin, comparativement à 1,8 million d’EVP en mars.1
- La capacité prévue devait augmenter à environ 2,28 millions d’EVP en juillet, sans compter d’autres traversées annulées.1
- Le faible nombre de navires commercialement inactifs et les perturbations des itinéraires continuent de limiter l’offre de navires utilisable. Au 29 juin, Alphaliner a recensé 84 navires commercialement inactifs, soit environ 241 000 EVP. Alphaliner a également recensé au moins 41 navires, totalisant environ 215 000 EVP, qui avaient été déroutés ou mis à l’abri en raison des perturbations au Moyen-Orient.2
Implications : Une capacité déployée plus élevée ne se traduit pas entièrement par une augmentation de l’offre utilisable. Le moment de la demande, les traversées annulées, les perturbations des itinéraires et l’espace disponible à bord des navires peuvent influer sur les conditions du marché. Les expéditeurs devraient comparer les options de traversée, les points d’entrée et les semaines de départ.
Sources : 1) JOC Quarterly Intelligence, 2) Alphaliner 27-2026
- Les mouvements de navires dans le détroit d’Ormuz sont demeurés limités, et le moment d’une réouverture plus générale restait incertain.
- Le 26 juin, les prix du mazout à très faible teneur en soufre étaient supérieurs de 36,6 % aux niveaux du 27 février à Singapour et de 21,9 % à Rotterdam.
- La hausse des coûts de soutage a contribué à l’imposition de suppléments pour carburant d’urgence et à l’augmentation des facteurs d’ajustement de soutage sur plusieurs corridors commerciaux.
- Les flux de conteneurs dans les ports nord-américains sont demeurés généralement stables, même si les volumes et les temps de séjour variaient selon le point d’entrée.
Implications : Les changements liés au carburant et aux itinéraires peuvent influer sur le temps de transit et le coût total du transport. L’incidence peut varier selon le corridor commercial et l’itinéraire. Les expéditeurs devraient examiner les options d’itinéraire, les exigences de transit et les suppléments applicables avant de réserver.
Source : JOC Quarterly Intelligence
Tendances en matière de conformité douanière et commerciale
L’application de la réglementation, les exigences en matière de données et l’incertitude liée aux politiques commerciales sont en hausse.
- Le CBP a lancé la phase II de CAPE pour certains scénarios de remboursement liés à l’IEEPA, y compris les entrées admissibles signalées aux fins de rapprochement qui ne sont pas encore liquidées ou qui se trouvent dans la période de liquidation indiquée.1
- Les mesures prises en vertu de la section 232 continuent d’élargir l’exposition aux tarifs douaniers, de nouveaux taux tarifaires visant les produits pharmaceutiques devant entrer en vigueur le 31 juillet 2026.2
- L’exactitude du classement et des données sur les importateurs devient de plus en plus essentielle, puisque les mises à jour de juillet du HTS introduisent des changements pour certains produits alimentaires, moteurs à turbine et produits dérivés du cuivre, tandis que le CBP prévoit également de désactiver dans ACE les numéros IOR inutilisés.3
Implications : Les importateurs devraient examiner leur exposition potentielle aux remboursements et au rapprochement liés à l’IEEPA, valider les classements HTS et le statut IOR, et se préparer à la poursuite des discussions sur les coûts, l’approvisionnement et la conformité liés aux tarifs douaniers.
- À compter du 1er juillet 2026, l’UE a commencé à mettre en œuvre des réductions tarifaires et un traitement en franchise de droits pour certains produits d’origine américaine, ce qui pourrait permettre aux importateurs de réaliser des économies de droits de douane. 4
- Le mécanisme d’ajustement carbone aux frontières (MACF) de l’UE est entré dans sa phase définitive en 2026, obligeant les importateurs de certains biens à forte intensité de carbone à respecter de nouvelles obligations en matière d’autorisation, de déclaration des émissions et de certificats.5
- L’UE met en œuvre la plus importante modernisation douanière depuis des décennies, notamment la création d’une nouvelle Autorité douanière de l’UE, le renforcement des exigences de partage des données et une transition progressive vers une plateforme centralisée de données douanières.6
Implications : Les entreprises qui commercent avec l’UE devraient évaluer les possibilités de réduire les coûts liés aux droits de douane tout en veillant à disposer des processus, des documents et des contrôles de données nécessaires pour répondre à l’évolution des exigences douanières, réglementaires et de durabilité.
Sources : 4) EU-Lex, 5) Commission européenne, 6) Réforme douanière de l’UE
- Le Canada a modifié la Licence générale d’importation (LGI) no 83 visant les produits d’aluminium, obligeant les importateurs à déclarer le pays de fusion et de coulée pour les importations d’aluminium visées. Les changements visent à améliorer la transparence de la chaîne d’approvisionnement et la surveillance des importations d’aluminium, la déclaration obligatoire entrant en vigueur le 1er octobre 2026.7
- Le projet de loi C-35 proposé au Canada renforcerait les restrictions visant les biens produits au moyen du travail forcé en créant une liste de produits à risque élevé, en augmentant les exigences de documentation des chaînes d’approvisionnement pour les importateurs et en élargissant les pouvoirs d’application de l’ASFC afin d’empêcher l’entrée au pays de marchandises non conformes.8
Implications : Les importateurs qui ne peuvent fournir les renseignements exigés sur l’origine ou la chaîne d’approvisionnement pourraient faire l’objet d’un examen accru de l’ASFC, subir des retards d’expédition ou être assujettis à d’éventuelles restrictions à l’importation.
Sources : 7) Canada.ca, 8) Parlement du Canada
Principaux points concernant la logistique et la distribution au niveau mondial
L’activité logistique du T2 a atteint son plus haut niveau en quatre ans, alors que l’IA et l’automatisation des entrepôts deviennent des éléments centraux de la logistique à contrat.
- Aux États-Unis, l’indice Logistics Manager’s Index a augmenté à 71,1 en juin 2026, son plus haut niveau depuis mai 2022, contre 69,5 en mai, sous l’effet d’une expansion plus rapide des niveaux de stocks.
- Les niveaux de stocks ont augmenté (+5,7 à 60,5), tandis que les coûts des stocks ont diminué (-8,2 à 75,90).
- La capacité d’entreposage s’est contractée (-3 à 47,5) et l’utilisation de la capacité d’entreposage a augmenté (+6,5 à 69,4), tandis que les prix d’entreposage ont progressé (+3,0 à 73,8).
- L’utilisation du transport a augmenté (+5,2 à 74,7).
Implications : Les dépenses de consommation se sont maintenues pendant la première moitié de l’année malgré l’inflation, ce qui donne aux détaillants la confiance nécessaire pour avancer l’arrivée de marchandises prévues pour la deuxième moitié de l’année. De plus, les tarifs douaniers pourraient augmenter plus tard en juillet; une partie de ce que nous observons est donc attribuable à une anticipation des expéditions avant la haute saison. Les solutions de logistique aller et retour capables de gérer efficacement les pointes saisonnières seront privilégiées.
Source : LMI
- La logistique à contrat entre dans une nouvelle phase où l’automatisation, l’orchestration et la visibilité fondées sur l’IA deviennent des capacités fondamentales plutôt que de simples projets d’innovation. Les chefs de file en IA concentrent leurs investissements sur la robotique, les tours de contrôle intelligentes, l’analyse prédictive et l’IA destinée aux clients.
- UPS MeRA (Message Response Automation) utilise l’IA générative pour automatiser les réponses aux courriels des clients et soutenir les agents du service à la clientèle.
- Return Vision de Happy Returns utilise la vision par ordinateur pour analyser les photos des articles retournés et repérer les retours suspects. Le système aide à détecter les produits contrefaits et les articles incorrects retournés aux détaillants.
- UPS Healthcare s’est associée à iRemedy afin d’offrir aux fabricants de dispositifs médicaux et du secteur de la santé une plateforme d’approvisionnement, de conformité et de logistique propulsée par l’IA.
Incidences : le rapport source confirme l’orientation stratégique d’UPS en matière de détection RFID, de soutien à la clientèle fondé sur l’IA, de vision par ordinateur pour la gestion des retours et de partenariats en logistique des soins de santé, tout en mettant également en évidence la robotique et les plateformes d’orchestration fondées sur l’IA.
Source : Ti Insights
- L’automatisation des entrepôts passe d’une discussion sur la question « devrions-nous automatiser? » à une approche plus pratique axée sur la façon dont les entreprises peuvent mettre en œuvre l’automatisation avec succès et de manière responsable.
- Les entreprises ont de plus en plus besoin de partenaires et de logiciels d’orchestration capables d’intégrer plusieurs systèmes dans une seule exploitation d’entrepôt coordonnée, plutôt que d’utiliser des équipements isolés.
- Une automatisation réussie exige une validation rigoureuse en amont, à l’aide d’outils comme les simulations et les jumeaux numériques, afin de s’assurer que la technologie et le modèle d’affaires fonctionnent dans des conditions réelles d’exploitation.
Implications : UPS Supply Chain Solutions est bien placée pour faire concurrence dans le domaine de l’automatisation des entrepôts, car le marché évolue vers les capacités que les grands fournisseurs 3PL peuvent offrir : conception de solutions de bout en bout, exécution opérationnelle, intégration des systèmes et déploiement rigoureux à grande échelle. UPS SCS est bien placée pour faire concurrence en tant que partenaire de confiance pour l’exécution de projets d’automatisation : en aidant les clients à déterminer où l’automatisation est avantageuse sur les plans financier et opérationnel, à intégrer les technologies appropriées et à exploiter ces solutions de façon fiable dans des chaînes d’approvisionnement complexes.
Source : SupplyChain247
En savoir plus à propos des services de UPS Supply Chain Solutions

Services de transport de UPS
Chez UPS SCS, nous sommes là pour simplifier l’expédition de fret. Trouvez le service de fret qui vous convient et faites circuler vos marchandises dans le centre d’expédition Portail UPS® Forwarding Hub.

Obtenez de l’aide sur les tarifs douaniers
Restez au courant des plus récents développements concernant les tarifs douaniers américains et de leurs répercussions potentielles sur le commerce mondial et les chaînes d’approvisionnement

Demandez à un expert
Vous avez des questions? Nous vous mettrons en communication avec les personnes les mieux placées pour vous répondre Parlez-nous un peu de vous et choisissez un sujet pour commencer.