2026 Q3 Global Freight Transportation and Logistics Trends

August 2026 - Updated for Q3, our industry professionals compiled freight and logistics trends and market updates for 2026 to help your business stay prepared for the future.
Global Macroeconomic Trends
Lower commodity prices in July eased inflationary pressures, but ongoing Middle East disruptions remain the key driver of near-term economic and financial uncertainty.
Key Macroeconomic Indicators Summary
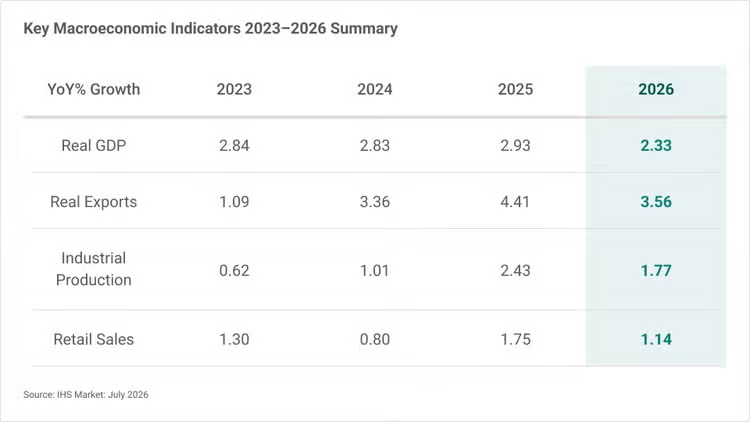
Key Macroeconomic Indicators Summary
- Real export projections have been revised up to 3.56% globally, driven by significant increases to projections from the APAC and US.
- Industrial production forecasts have slightly declined to 1.77%, with significant decreases from the Middle East region.
- Retail sales forecast lowered to 1.14% from April 2026 projections, driven by declines in China and the wider APAC region
Source: IHS-Markit: July 2026
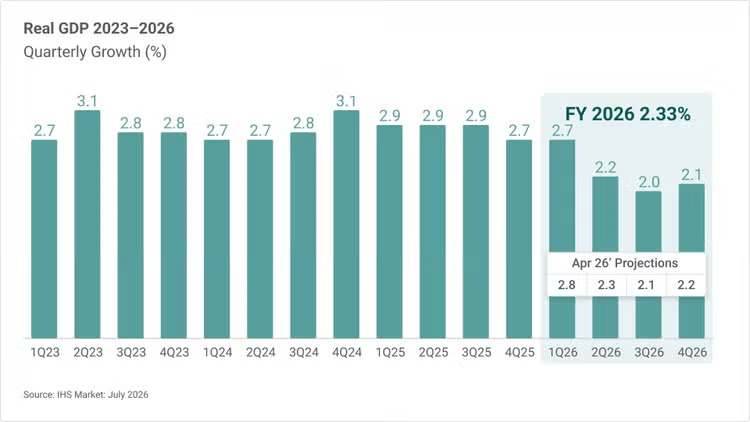
Real GDP Quarterly Growth 2023-2026
Real GDP Quarterly Growth 2023-2026
2026 Real GDP Forecast
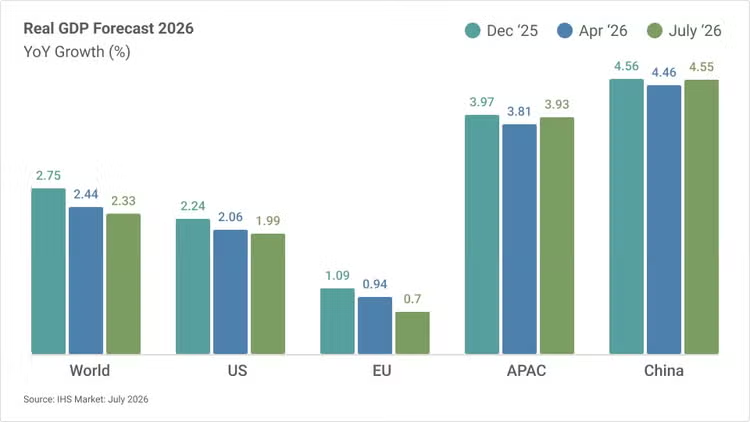
2026 Real GDP Forecast
- World GDP growth forecasts for 2026 declined from April 2026, with July projections down across key regions in Western Countries while up in the APAC region and global growth of 2.33%.
Manufacturing PMI by Market
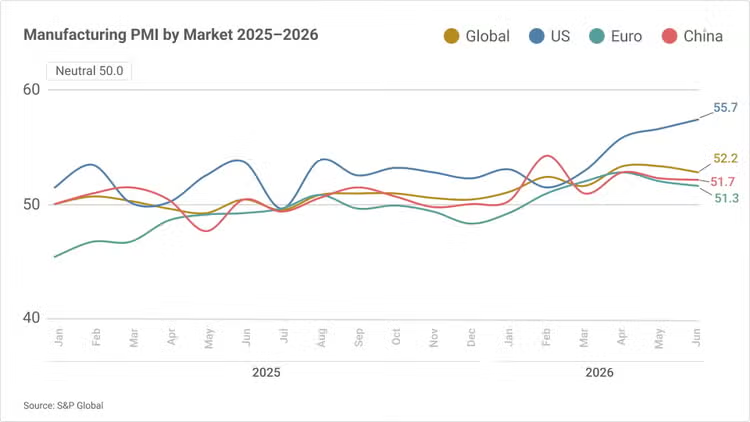
Manufacturing PMI by Market
- Global manufacturing PMI eased to 52.2 in June, as the rate of growth slowed for two consecutive months. However, still an expansion above the neutral point.
- China’s manufacturing PMI fell slightly to 51.7 in June, still above the 50.0 neutral mark, signifying manufacturing expansion.
- US manufacturing PMI rose to 55.7 in June, up from the 55.1 in May depicting a growth in business expansion.
- Eurozone PMI contracted slightly to 51.3 in June from the expansion of 51.6 in May.
Source: S&P Global
Quarterly CPI Inflation Rate
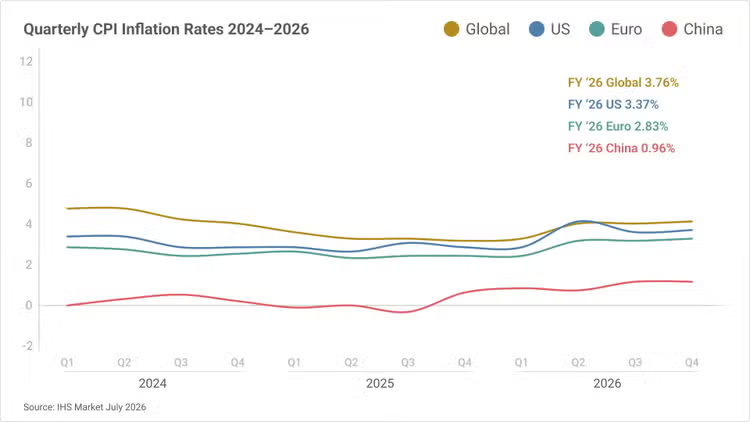
Quarterly CPI Inflation Rate
- Global CPI for 2026 has increased from previous projections in April, remaining above the pre-conflict projections.
- The US inflation rate slightly decreased from April projections to 3.37% for the year, mainly driven by the lower oil prices.
- The Eurozone inflation forecast was revised down to 2.83% in July, led by lower energy price assumptions.
- China’s inflation projection was revised up to 0.96% in July, from 0.85% in April.
Source: ISH Markit

Air Freight Industry Update
Global air cargo demand grows as AI-related and technology shipments displace eCommerce as its main driver while capacity rebuilds.
Air Freight Demand vs. Capacity
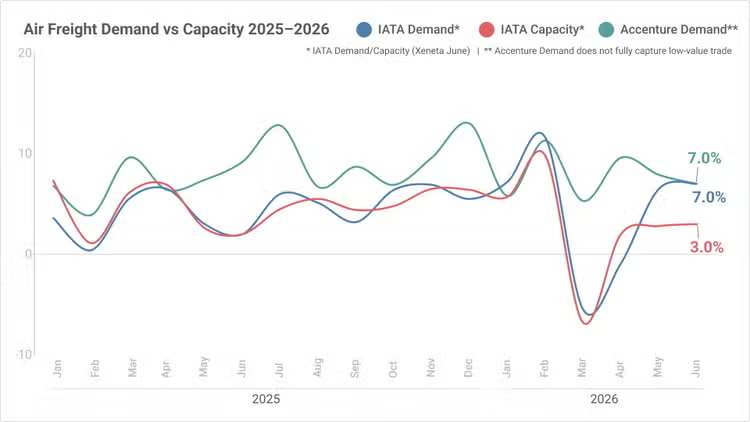
Air Freight Demand vs. Capacity
- Demand grew +7.0% YoY in June , up from the (+4.0% YoY) expansion reported in May.
- Shipments related to artificial intelligence, data centers and semi-conductors have been the main driver of volume on the most transpacific lanes and impactful contributor for demand growth.
- Capacity growth edged up +3.0% YoY in June from the +1.0% YoY growth in May , and with an easing and downward effects on global spot rates which declined -38% YoY in June from the +41% reported in May.
* IATA Demand/Capacity (Xeneta June)
** Accenture Demand does not fully capture low-value trade
Sources: Accenture Cargo, IATA, Xeneta
Air Freight Industry Rates
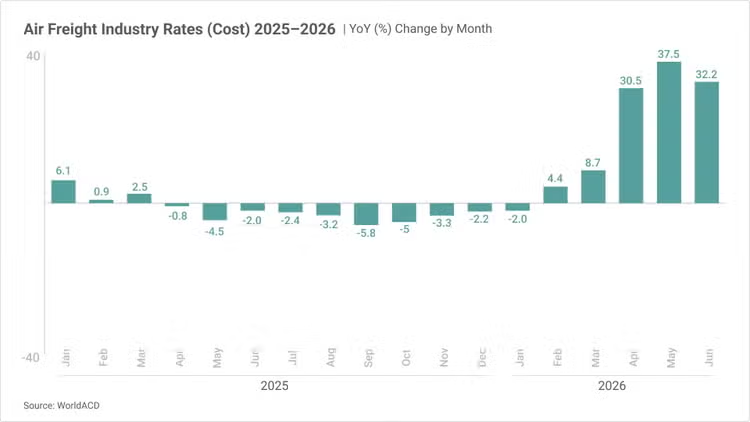
Air Freight Industry Rates
- Average global air rates, a mix of both spot and contract rates edged downward (+32.2 %) YoY in June from the +37.5% YoY in May due to declining jet fuel costs and returning capacity.1
- Rates into the Gulf regions on the back of the AI demand surge are beginning to soften even as rates from Southeast Asia (+46%), South Asia (+88%) and Europe (+79%) are still elevated compared to before the start of the crisis.2
- Jet fuel prices have eased Month–on-Month (MoM) to -22.8% in June, the effect of the fragile negotiation to the Middle East crisis.3
Air Freight Industry Trends
Easing inflation supports near-term growth, though Middle East tensions remain a key source of macroeconomic uncertainty.
- Global air cargo demand grew 12.6% YoY in 2Q 2026, with June volumes increasing 7.0% YoY.1
- Global semiconductor and AI-related demand more than doubled YoY in April, with sales increasing 106%, driven primarily by growth on Transpacific lanes, despite lower China-US demand due to tariff restrictions.1
- While AI-driven demand continued to support the air freight sector, e-commerce demand declined 7% YoY in May 2026, marking its sixth consecutive month of contraction.1
- Through May 2026, demand expanded across all regions except the Middle East (-12.8%).2
Implications: Strong semiconductor and AI-related demand, the primary driver of air cargo growth in 2Q 2026, is expected to continue into 3Q, with Transpacific lanes remaining the key growth market.
Sources: 1) Xenata, 2) IATA
- Global air cargo capacity grew 7.8% YoY in 2Q 2026, with June capacity up 3.0% YoY as capacity continued to recover following the fragile ceasefire in the Middle East.1
- Overall capacity expanded 0.7% over 2Q 2026. Although declines in Middle East markets moderated, key lanes remained below prior-year levels, including EU→MESA (-9.7%), MESA→EU (-6.8%), MESA→APAC (-3.7%), and APAC→MESA (-3.0%).3
- Widebody belly capacity declined 4.2%, while freighter capacity increased 4.3% in 2Q 2026, driven by reduced belly hold capacity among Middle Eastern carriers.3
- Global air cargo rates increased an average of 33.4% YoY in 2Q 2026, including 32.2% in June, 37.5% in May, and 30.5% in April.4
Implications: Brent crude oil prices have rebounded nearly 20% since early July, while traffic through the Strait of Hormuz has stalled. Middle East geopolitical tensions are expected to remain the key driver of near-term air cargo rates and market dynamics.
Sources: 1) Xenata, 3) Accenture Cargo, 4) WorldACD
- Global growth remains fragile, with slower economic momentum across most major economies, including the US, China, and India, despite modest improvement in recent business activity indicators.
- Middle East developments remain the key swing factor for the global economy, driving volatility in energy prices, inflation expectations, and monetary policy outlooks.
- Lower commodity prices have improved the near-term outlook, supporting lower inflation forecasts and slightly stronger growth prospects for many net oil-importing economies.
Interest rates are expected to remain elevated for longer, as central banks balance easing inflation pressures against ongoing geopolitical risks and renewed oil price volatility.
Implications: Moderating inflation may help stabilize business spending and inventory replenishment activity, supporting international trade flows. Air cargo demand should remain resilient, though geopolitical tensions and fuel price volatility could drive short-term market uncertainty.
Source: IHS Markit
North American Air Freight Overview
Fuel drives higher transportation expenditures higher with US-Iran conflict intensifying energy rates.
Cass Freight Index Shipments 2025-2026
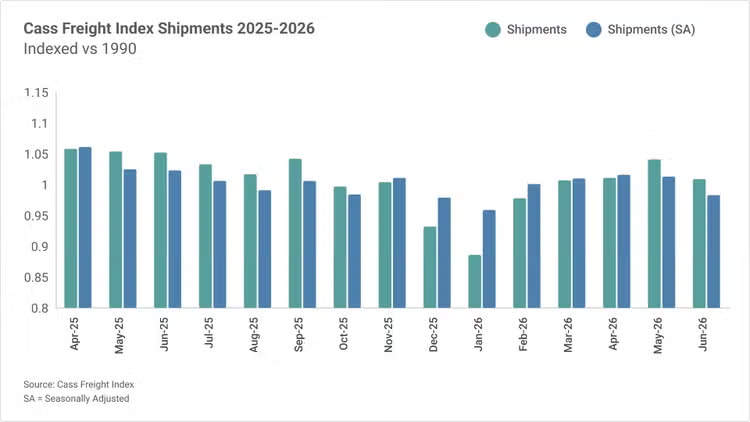
Cass Freight Index Shipments 2025-2026
- Cass Freight Index reported expenditures up 11.2% YoY in June and shipments decreased 3.1% MoM, and decreased YoY 4.1%.
- Volume is down because of declining capacity, and fuel prices are also impacting demand for goods.
Source: Cass Freight Index
Purchasing Managers’ Index
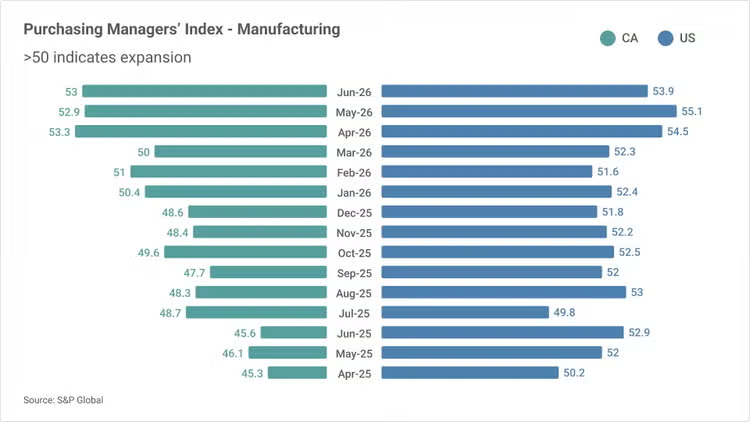
Purchasing Managers’ Index
- Per the recent S&P Global Market Intelligence report, the US manufacturing sector growth expands despite renewed fall in employment and business confidence.
- Some manufacturers are reporting increasing stock as a precaution against future price rises or supply shortages, underscoring the growing concern about how the war might cause problems for factories in the weeks ahead.
- Businesses remained positive about output prospects for the coming months, but the overall degree of optimism fell to an eight-month low.
- Positive sentiment was linked to hopes that easing of inflationary pressures and geopolitical tensions would help stimulate sales and production. Yet, concerns of the health of the US economy continued to weigh on business confidence.
Source: S&P Global
North American Air Freight Industry Trends
Geopolitical tensions and macroeconomic factors are cause for supply chain concerns
- The US declined to renew the USMCA agreement which shifts the deal into uncertainty and rolling annual reviews instead of once every six years.1
- The annual reviews shift of the USMCA, of which governs about $2T annually in goods and services between US, Mexico, and Canada, raises the possibility of harming businesses that rely on the USMCA and could limit investments across North America.2
Implications: USMCA uncertainty may increase supply chain complexity across North America, driving greater demand for effective transportation solutions from experienced freight forwarders.
Sources: 1) Yahoofinance, 2) The Guardian
- Near term stabilization in US LTL could not happen by year end as capacity and rate hikes send ripples throughout the supply chain as we are in an acutely tight market.3
- Tariff-related uncertainties, supply disruptions, and on-shoring incentives are prompting automakers to pivot North American production strategies.4
- More than 55% of vehicles sold in the US today are manufactured in the US and this trend is likely to increase in coming years, bolstered by OEM expansions and supply chain localization.4
Implications: As LTL markets tighten and North American manufacturing continues to localize, shippers need transportation solutions that provide flexibility and supply chain resilience that mitigates capacity constraints and optimize supply chains.
Sources: 3) S&P Global, 4) PWC
- The US Bureau of Labors Statistics (BLS) reported inflation 3.5% YoY increase despite energy declining 5.7% due to a pause in the US-Iran conflict but with inflation risks re-igniting in coming months amid renewed tensions between the two countries.5
- S&P Global’s Mexico Manufacturing PMI rose MoM 3.4% to 51.3 in June 2026 signaling improvement in operating conditions. Looking ahead, manufacturers remain optimistic, with business confidence rising to three month high.6
- The Federal Reserve are expected to raise interest rates in September after releasing a statement saying the rate-setting Federal Open Market Committee “will deliver price stability” to move toward their 2 percent borrowing rate.7
Implications: Improving Mexican manufacturing activity and ongoing supply chain uncertainty are pushing businesses to target prioritize freight cost with reliable cross-border supply chain strategy.
Sources: 5) BLS, 6) Trading Economics, 7) CNBC

Ocean Freight Industry Update
The early Q2 peak lifted volumes and rates. In Q3, broader trade growth remains positive, while US import momentum is expected to soften. Effective capacity remains constrained, so rate conditions continue to vary by trade.
Demand vs. Capacity
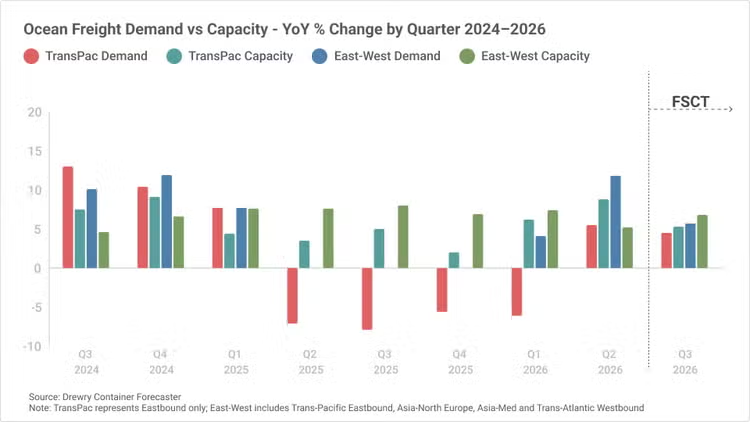
Ocean Freight Demand vs Capacity
- Q3 demand remains positive year over year in the broader trade measures shown. The chart shows continued growth in trans-Pacific and East–West demand during the forecast quarter.1
- Drewry’s broader trans-Pacific demand forecast differs from JOC’s US import outlook. JOC projects total US imports to decline year over year by 6.4% in July, 8.6% in August, and 2.2% in September. The difference reflects separate data scopes and forecasting methods.2
- Growth is lower than the Q2 peak. This does not mean the charted demand measures are contracting. It means the year-over-year growth rate is moderating after the stronger Q2 period.1
- Effective capacity remains tighter than nominal fleet growth suggests. Longer voyages, equipment positioning, low commercial idling, and Middle East disruption continue to reduce usable supply.3
- Q3 capacity remains linked to routing developments. Drewry expects a gradual return to Suez, while Alphaliner reported limited-service changes at the start of Q3.4
Sources: 1) Drewry, 2) JOC Quarterly Intelligence, 3) JOC Magazine, 4) Alphaliner Newsletter 27-2026
Rates
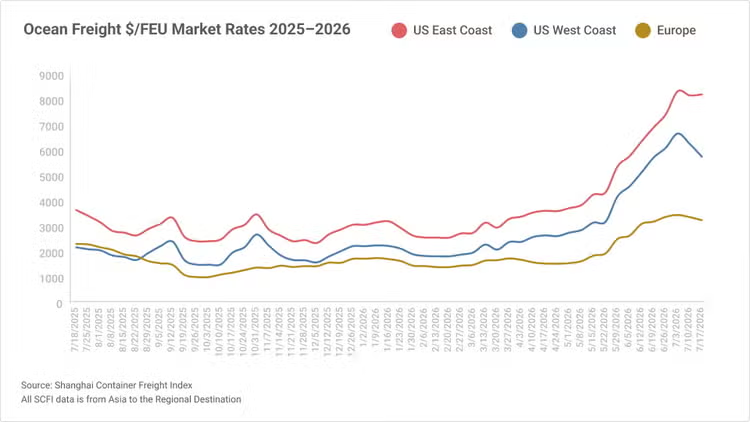
Rates
- Q3 began with rates above early-2026 levels. The chart shows sharp Q2 increases on the US East Coast and US West Coast, followed by some moderation in July.
- The Q3 rate environment reflects both demand and effective capacity. JOC linked the earlier increase to stronger near-term demand, longer routing, port congestion and higher fuel costs.
- Higher rates do not indicate the same market conditions across all lanes. Each series reflects a different trade and, in the case of Europe, a different container basis.
- JOC projects a softer US import outlook during Q3. Elevated opening-quarter rates should therefore not be read as evidence of stronger demand across the full quarter.
Source: JOC Quarterly Intelligence
Ocean Freight Industry Drivers
Disruption and longer routing constrain effective capacity while demand remains uneven in Q2 2026.
- JOC expects the current import wave to slow during the third quarter. Total US imports are projected to decline 6.4% year over year in July, 8.6% in August, and 2.2% in September.1
- Asia–US imports increased 19.5% year over year in May, after declining 4.3% during the first four months of 2026.1
- Forward booking data remained firm through June, indicating continued near-term demand on the trans-Pacific.1
- Demand differs by trade. North Europe–US imports increased 6.2% year over year in May, while Mediterranean imports increased 22.8%. However, import rates remained softer than on the trans-Pacific.1
Implications: The May increase shows short-term strength, while the third-quarter outlook remains softer year over year. Conditions may differ by trade and shipment timing. Shippers should review booking needs by lane and departure period.
Source: 1) JOC Quarterly Intelligence
- Frontloaded cargo, reduced available vessel capacity, and higher bunker costs contributed to higher trans-Pacific spot rates from mid-May.1
- Carriers deployed approximately 1.98 million TEUs of capacity in June, compared with 1.8 million TEUs in March.1
- Planned capacity was expected to increase to approximately 2.28 million TEUs in July, excluding additional blank sailings.1
- Low commercial idling and routing disruption continue to limit usable vessel supply. Alphaliner recorded 84 commercially idle vessels, or about 241,000 TEUs, on June 29. It also identified at least 41 vessels, totaling about 215,000 TEUs, that were diverted or sheltered because of Middle East disruption.2
Implications: Higher deployed capacity does not fully translate into usable supply. Demand timing, blank sailings, routing disruption, and available vessel space can affect market conditions. Shippers should compare sailing options, gateways, and departure weeks.
Sources: 1) JOC Quarterly Intelligence, 2) Alphaliner 27-2026
- Vessel movements through the Strait of Hormuz remained limited, and the timing of a broader reopening was uncertain.
- On June 26, very-low-sulfur fuel oil prices were 36.6% above February 27 levels in Singapore and 21.9% higher in Rotterdam.
- Higher bunker costs contributed to emergency fuel surcharges and bunker adjustment factor increases on several trades.
- North American container port flows remained generally stable, although volumes and dwell times varied by gateway.
Implications: Fuel and routing changes can affect transit time and total transportation cost. The impact may differ by trade lane and routing. Shippers should review routing options, transit requirements, and applicable surcharges before booking.
Source: JOC Quarterly Intelligence
Customs & Trade Compliance Trends
Rising enforcement, data requirements, and trade policy uncertainty.
- CBP has launched CAPE Phase II for certain IEEPA refund scenarios, including eligible entries flagged for reconciliation that remain unliquidated or are within the stated liquidation window.1
- Section 232 activity continues to broaden tariff exposure, with new pharmaceutical tariff rates scheduled to take effect July 31, 2026.2
- Classification and importer data accuracy are becoming more critical, as July HTS updates introduce changes across select food products, turbine engines, and copper derivative products, while CBP also plans to deactivate unused IOR numbers in ACE.3
Implications: Importers should review potential IEEPA refund/reconciliation exposure, validate HTS classifications and IOR status, and prepare for continued tariff-driven cost, sourcing, and compliance discussions.
- Effective July 1, 2026, the EU began implementing tariff reductions and duty-free treatment for certain U.S.-origin products, creating potential duty savings for importers 4
- The EU Carbon Border Adjustment Mechanism (CBAM) entered its definitive phase in 2026, requiring importers of certain carbon-intensive goods to meet new authorization, emissions reporting, and certificate obligations.5
- The EU is implementing the most significant customs modernization effort in decades, including a new EU Customs Authority, enhanced data-sharing requirements, and a phased move toward a centralized customs data platform.6
Implications: Companies trading with the EU should evaluate opportunities to reduce duty costs while ensuring they have the processes, documentation, and data controls needed to meet evolving customs, sustainability, and regulatory requirements.
Sources: 4) EU-Lex, 5) European Commission, 6) EU Customs Reform
- Canada has amended General Import Permit (GIP) No. 83 for aluminum products, requiring importers to report the country of smelt and cast information for applicable aluminum imports. The changes are designed to improve supply chain transparency and aluminum import monitoring, with mandatory reporting taking effect October 1, 2026.7
- Canada’s proposed Bill C-35 would strengthen restrictions on goods produced with forced labor by creating a list of high-risk products, increasing importer supply chain documentation requirements, and expanding CBSA enforcement authority to prevent non-compliant goods from entering the country.8
Implications: Importers that cannot provide required origin or supply chain information could face increased CBSA scrutiny, shipment delays, or potential import restrictions.
Sources: 7) Canada.ca, 8) Parliament of Canada
Global Logistics & Distribution Highlight
2Q logistics activity hit a four-year high as AI and warehouse automation become core to contract logistics.
- The Logistics Manager’s Index in the US increased to 71.1 in June 2026, the highest since May 2022, from 69.5 in May, driven by faster expansion in Inventory Levels.
- Inventory Levels expanded (+5.7 to 60.5) while Inventory Costs decreased (-8.2 to 75.90).
- Warehousing Capacity contracted (-3 to 47.5) and Warehousing Utilization increased (+6.5 to 69.4) while Warehousing Prices increased (+3.0 to 73.8).
- Transportation Utilization increased (+5.2 to 74.7).
Implications: Consumer spending has held through the first half of the year despite inflation, giving retailers confidence in bringing forward goods for the second half of the year. Also, tariffs may increase in later July, so some of what we’re seeing is a pull-forward ahead of peak season.ward + reverse logistics to manage seasonal surges efficiently will be favored.
Source: LMI
- Contract Logistics is entering a new phase where AI-driven automation, orchestration, and visibility are becoming foundational capabilities rather than innovation projects. The leaders in AI are concentrating investments on robotics, intelligent control towers, predictive analytics, and customer-facing AI.
- UPS MeRA (Message Response Automation) uses generative AI to automate customer email responses and support customer service agents.
- Happy Returns' Return Vision uses computer vision to analyze photos of returned items and identify suspicious returns. The system helps detect counterfeit products and incorrect items being sent back to retailers.
- UPS Healthcare partnered with iRemedy to provide an AI-powered procurement, compliance, and logistics platform for medical device and healthcare manufacturers.
Implications: The source report validates UPS's strategic direction around RFID sensing, AI-enabled customer support, computer vision for returns management, and healthcare logistics partnerships, while also highlighting robotics and AI orchestration platforms.
Source: Ti Insights
- Warehouse automation is shifting from a “should we automate?” discussion to a more practical focus on how companies can implement automation successfully and responsibly.
- Companies increasingly need partners and software orchestration that can integrate multiple systems into one coordinated warehouse operation, rather than isolated pieces of equipment.
- Successful automation requires disciplined upfront validation (using tools like simulations and digital twins) to ensure both the technology and business model work in real-world operations.
Implications: UPS Supply Chain Solutions is well positioned to compete in warehouse automation because the market is moving toward the capabilities large 3PLs can provide end-to-end solution design, operational execution, systems integration, and disciplined deployment at scale. UPS SCS is positioned to compete by being the trusted automation execution partner: helping customers identify where automation makes financial and operational sense, integrating the right technologies, and running those solutions reliably inside complex supply chains.
Source: SupplyChain247
More From UPS Supply Chain Solutions

UPS Freight Services
At UPS SCS, we’re here to simplify shipping freight. Find the freight service that’s right for you and get your freight moving in the UPS Forwarding Hub.

Get Tariff Support
Stay informed on the most recent US tariff developments and potential impacts to global trade and supply chains

Ask an Expert
Questions? We’ll connect you to people with answers. Tell us about you, and choose a topic to get started.