2026 Q4 Global Freight Transportation and Logistics Trends

October 2026 - Updated for Q4, our industry professionals compiled freight and logistics trends and market updates for 2026 to help your business stay prepared for the future.
This Page Contains:
- Global Macroeconomic Trends
- International Air Freight Industry Update
- International Air Freight Industry Trends
- North American Air Freight Overview
- North American Air Freight Industry Trends
- Ocean Freight Industry Update
- Ocean Freight Industry Drivers
- Customs & Trade Compliance Trends
- Global Logistics & Distribution Highlight
- Regional Perspectives
Global Macroeconomic Trends
Global growth forecasts improved in October as economic activity proved more resilient than expected, but rising energy prices, renewed inflationary pressures and tighter financial conditions are increasing downside risks heading into 2027.
Key Macroeconomic Indicators Summary
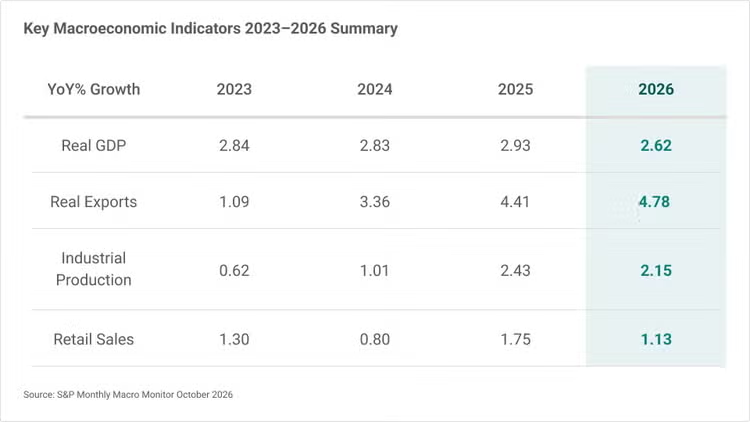
Key Macroeconomic Indicators Summary
- Inflation risks have re-emerged as a key concern. Brent crude oil prices have remained above $100/barrel since September due to ongoing Gulf supply disruptions, prompting upward revisions to inflation forecasts across most major economies.
- Industrial production forecasts improved to 2.15%, driven by stronger manufacturing activity, technology exports and AI-related investment, particularly across Asia-Pacific economies.
- Major central banks are expected to raise interest rates again before year-end, while rising sovereign bond yields and tighter financial conditions increase the risk of slower growth in 2027 despite stronger near-term economic performance.
Source: S&P Monthly Macro Monitor October 2026
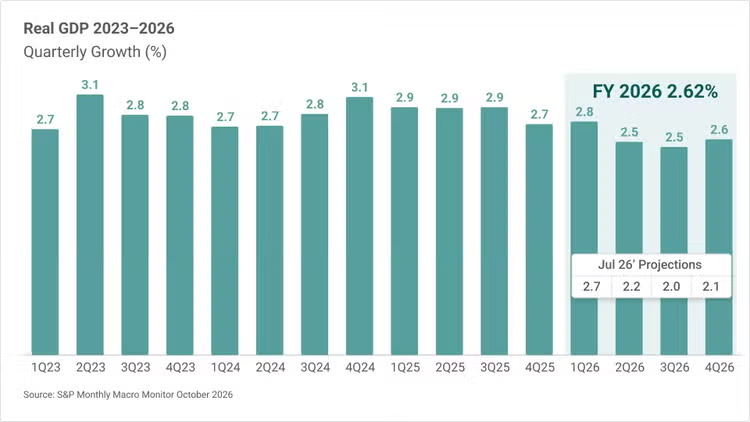
Real GDP Quarterly Growth 2023-2026
Real GDP Quarterly Growth 2023-2026
2026 Real GDP Forecast
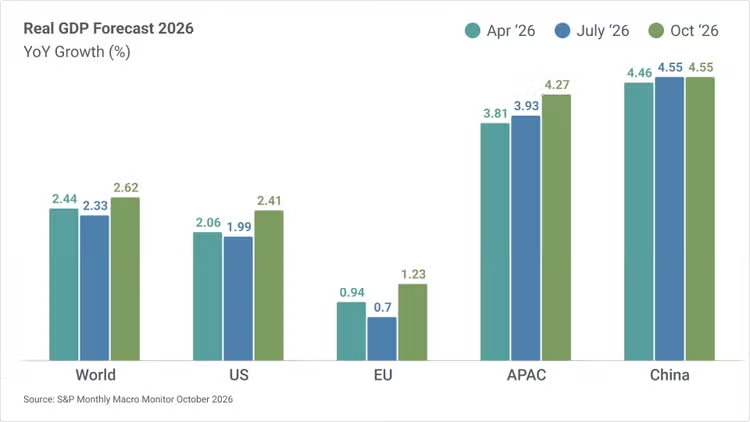
2026 Real GDP Forecast
- World GDP growth forecasts were revised upward to 2.62%, supported by stronger economic momentum in the US, APAC and China. Global trade activity also remains resilient, with export growth forecasts increasing to 4.78%.
Manufacturing PMI by Market
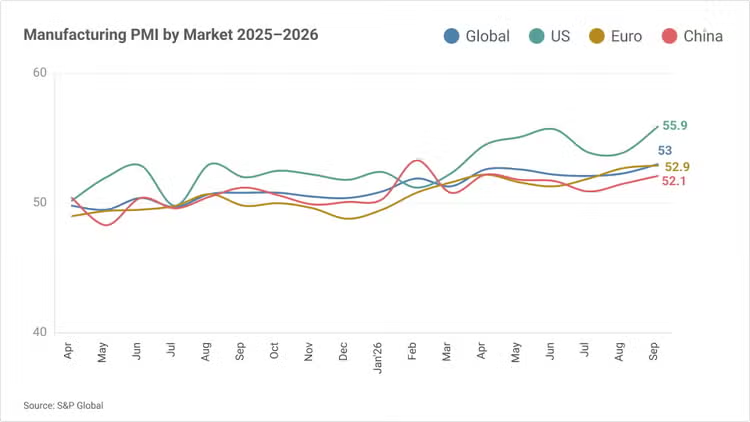
Manufacturing PMI by Market
- Global manufacturing momentum improved during Q3, contributing to the strongest pace of global economic expansion since 2021 as manufacturing regained momentum alongside continued services growth.
- US manufacturing activity remained a key outperformer, with September PMI data indicating the fastest overall economic growth since mid-2021 and continued strength in domestic demand and investment.
- China's manufacturing sector continued to expand, supported by export resilience, technology-related demand and recent policy measures aimed at stabilizing growth.
- Eurozone manufacturing remained in expansion territory and improved alongside strengthening services activity, although elevated inflation and tighter financial conditions continue to weigh on the outlook.
Source: S&P Global
Quarterly CPI Inflation Rate
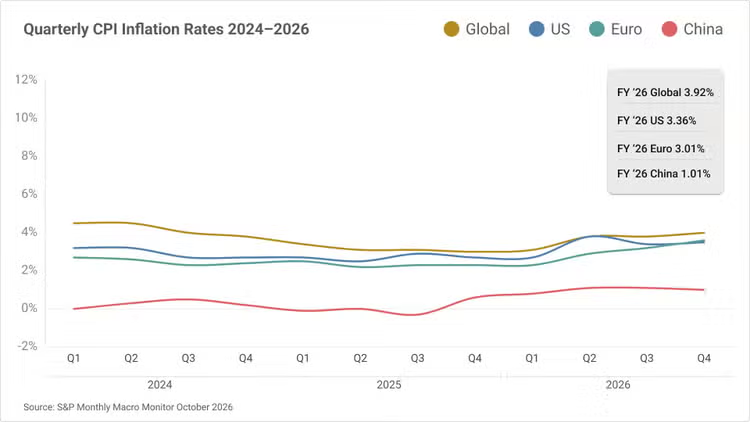
Quarterly CPI Inflation Rate
- Global CPI forecasts for 2026 increased to 3.9%, reflecting rising commodity and energy prices, persistent supply disruptions and broadening inflationary pressures across major economies.
- US inflation forecasts were revised upward to 3.4%, driven by higher energy costs and stronger-than-expected economic activity despite continued resilience in consumer demand.
- Eurozone inflation forecasts increased to 3.0%, as higher oil and gas prices feed through to food, manufactured goods and services, keeping inflation above central bank targets for longer.
- China's inflation outlook remains relatively muted at 1.0%, although forecasts are slightly higher than earlier in the year amid improving domestic demand and policy support measures.
Source: S&P Monthly Macro Monitor October 2026

International Air Freight Industry Update
Strengthening demand and limited capacity growth tighten market conditions heading into Q4.
Air Freight Demand vs. Capacity
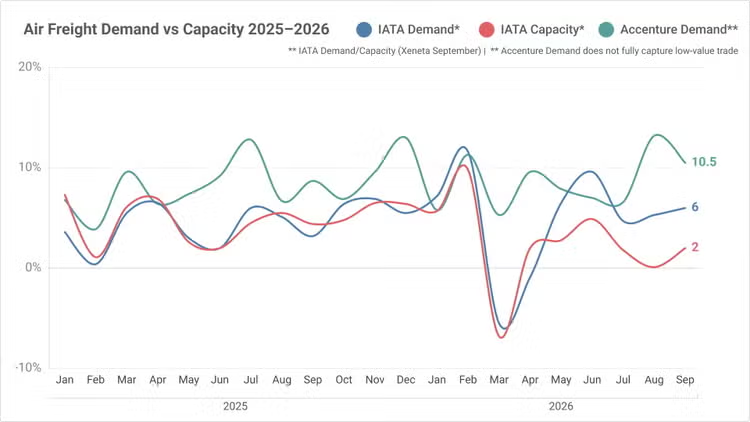
Air Freight Demand vs. Capacity
- Demand growth rebounded from mid-year softness, reaching +6.0% in September and signaling continued momentum in global air cargo volumes.
- Capacity expansion lost momentum through the summer, declining from +4.9% in June to just +2.0% in September.
- With demand growing approximately three times faster than capacity in September, market fundamentals continue to tighten heading into year-end.
* IATA Demand/Capacity (Xeneta September)
** Accenture Demand does not fully capture low-value trade
Sources: Accenture Cargo, IATA, Xeneta
Air Freight Industry Rates
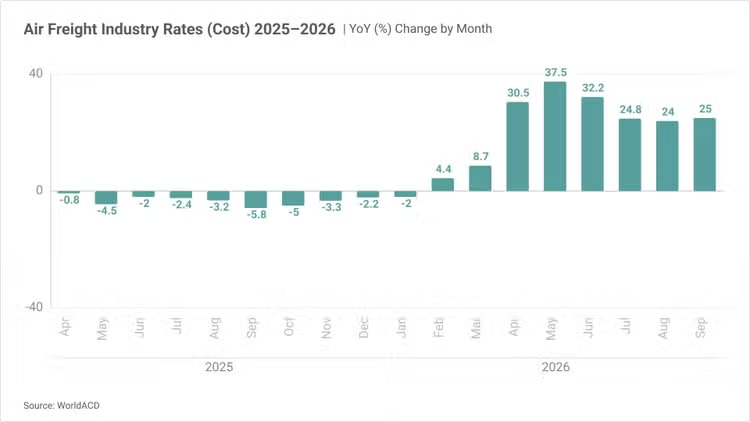
Air Freight Industry Rates
- Global air cargo rates remained approximately 25% higher YoY in September, reflecting sustained demand strength and stable capacity despite ongoing geopolitical and fuel-cost pressures.1
- Rates increased modestly from August as global volumes rebounded, with Asia-North America continuing to outperform while Asia-Europe remained under pressure from reduced cross-border eCommerce shipments.1
- Over the next quarter, rates are expected to remain elevated during the peak shipping season, supported by strong technology-sector demand, higher fuel costs and potential supply chain disruptions linked to Middle East tensions.1, 2
International Air Freight Industry Trends
Demand continues to outpace capacity, reinforcing the need for agile capacity strategies.
- Global air cargo demand increased +6% YoY in September, exceeding capacity growth of +2% YoY.1
- IATA reported August demand growth of 4.4% YoY while capacity declined 0.1% YoY, reinforcing continued capacity tightness.2
- Capacity utilization strengthened, with Xeneta's dynamic load factor rising to 62%, reflecting tighter market conditions.1
- Spot rates remained elevated at $3.10/kg, up 27% YoY, supported by sustained demand and higher fuel costs.1
Implications: Capacity remains disciplined across key trade lanes, keeping rates elevated. Early forecasting and proactive capacity planning remain critical to securing space and controlling transportation costs.
- 60% of new contracts signed in Q3 were for three months or less, compared to 25% one year ago.1
- Annual contracts continue to decline, with the share of 12-month agreements falling from 40% to 25% year-over-year.1
- Shippers increasingly seek "floating mechanisms" that adjust pricing based on market conditions rather than locking into fixed annual rates.1
- Jet fuel prices remain elevated and geopolitical tensions continue to create uncertainty across global transportation markets.2
Implications: Customers increasingly value pricing and capacity flexibility amid ongoing market volatility. Carriers and forwarders may need more dynamic commercial models to remain competitive and maintain customer commitments.
- China-to-Europe eCommerce exports declined 40% YoY, pressured by the EU's new low-value customs duty.1
- China-to-US eCommerce exports increased 17% YoY, continuing their recovery and supporting Transpacific demand.1
- Asia-North America remained the strongest major air cargo corridor, according to IATA.2
- Middle East-linked trade lanes continue to face disruption and elevated transportation costs due to ongoing geopolitical tensions.1, 2
Implications: Regional conditions continue to diverge across major trade lanes. Customers should prioritize lane-specific sourcing, pricing and capacity strategies rather than relying on broad market assumptions.
North American Air Freight Overview
A widening North American manufacturing divergence exists yet cost and supply disruptions are likely through year-end 2026.
US PMI Manufacturing Monthly Data
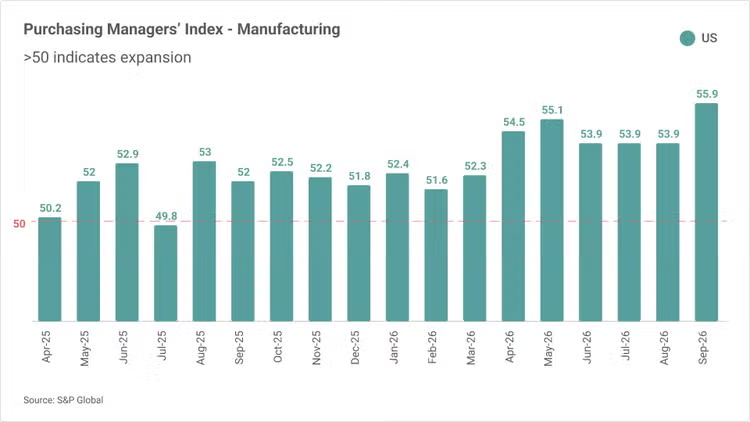
US PMI Manufacturing Monthly Data
- US manufacturing momentum strengthened considerably by faster growth in production and new orders as supply chain challenges persist, contributing to further uplift in cost inflation.1
Source: 1) S&P Global
Canada PMI Manufacturing Monthly Data
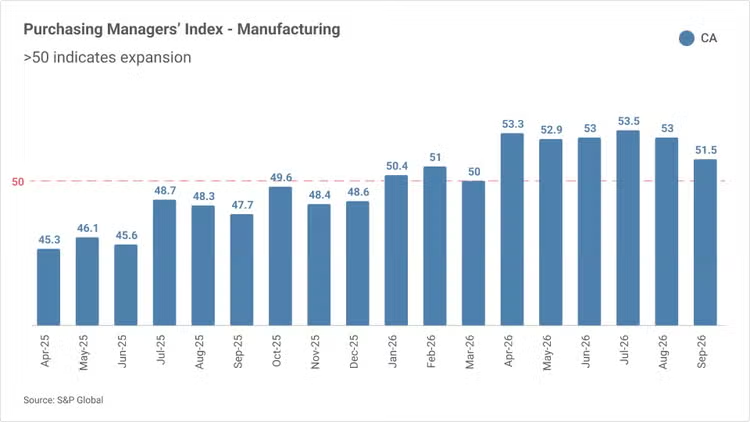
Canada PMI Manufacturing Monthly Data
- Canadian manufacturing remained in expansion territory but a spike in cost inflation and a fall in confidence signaled as businesses grapple with supply-side disruptions.2
Source: 2) S&P Global
Mexico PMI Manufacturing Monthly Data
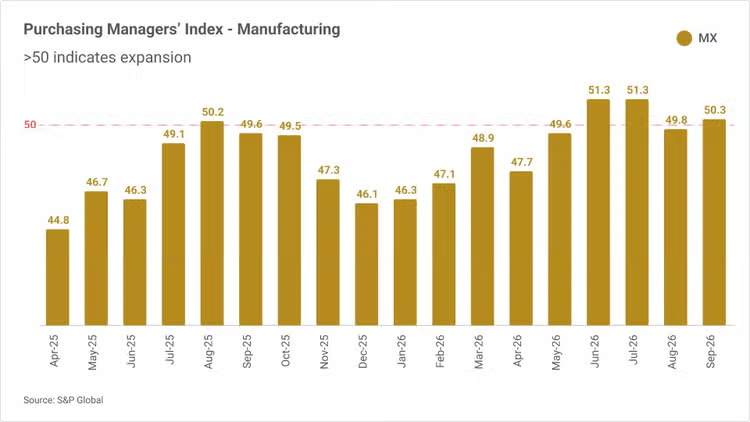
Mexico PMI Manufacturing Monthly Data
- Mexican manufacturing recovered, however output and employment continued to fall, indicating a fragile rather than broad-based recovery.3
Source: 3) S&P Global
Cass Freight Index Shipments
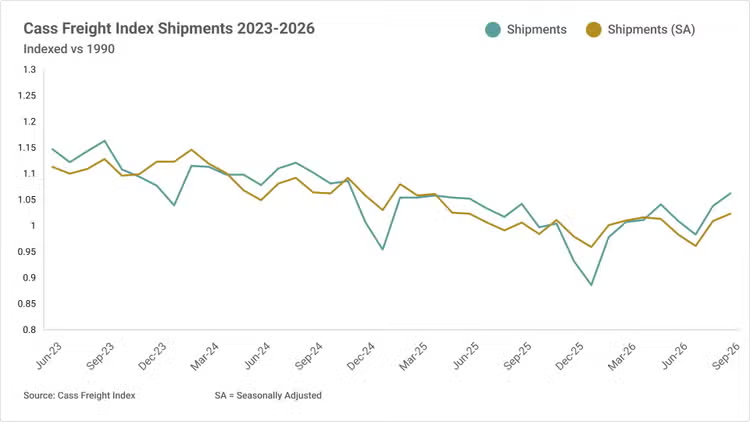
Cass Freight Index Shipments
- CASS Shipment index rose 1.9% YoY after a 2.3% rise in September.1
- Two months generally does not make a trend, and rising oil prices and interest rates are limiting factors, the cycle in on a positive track.1
Source: 1) Cass Freight Index
Cass Freight Index Expenditures
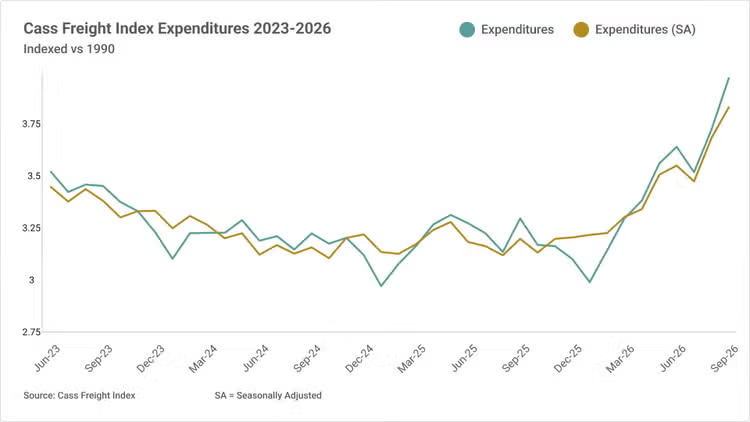
Cass Freight Index Expenditures
- CASS Expenditures Index rose 20.4% YoY growth in Sept up to a 6.7% MoM gain from the prior month of August.1
- The acceleration in Expenditures was driven by higher shipments, rates, and fuel surcharges.1
Sources: 1) Cass Freight Index
North American Air Freight Industry Trends
Inflation driven by fuel cost sits atop the strategic concerns for businesses and carriers.
- American Transportation Research Institute (ATRI) survey reported fuel prices in 2026 as the number one concern for carriers displacing US economy as number one in 2025.1
- Stricter trucking enforcement could complicate driver availability and border operations, adding uncertainty for carriers and shippers moving freight between the United States and Mexico.2
Implications: North American supply chain challenges and possible freight disruptions concerns due to fuel cost and pivoting freight policy enforcement of illegal operators creating obstacles for legitimate cross-border carriers.
Sources: 1) freightwaves.com 2) freightwaves.com
- Freight volumes remain mostly stagnant, with pockets of strength in certain sectors and regions, but the reduction in freight hauling capacity has shifted the balance between supply and demand.3
- AI investment continues to account for an outsized share of economic growth with hyperscalers rapidly tapping debt markets and making sizable investment commitments for 2027, that tailwind is unlikely to fade anytime soon.4
- Beyond AI, there are also encouraging signs that business investment is broadening into more traditional areas, like transportation and industrial equipment.4
Implications: The freight recovery carries momentum moving forward even though AI investments, and non-AI investments from businesses face headwinds.
Sources: 3) ttnews.com 4) economics.TD.com
- The US Bureau of Labors Statistics (BLS) reported inflation 3.7% YoY increase 0.4% MoM from August with a gasoline index increase of 9.1%.5
- From escalation in the Middle East to Canada and the US’s escalating tariff dispute, neither complex conflict look to have a resolution in the near future, which will likely raise the forecast for oil prices and higher inflation.6
Implications: Businesses may look to insulate themselves from probable higher inflation on the horizon by strategizing with experienced and integrated carriers that can develop cost-effective freight transport solutions.

Ocean Freight Industry Update
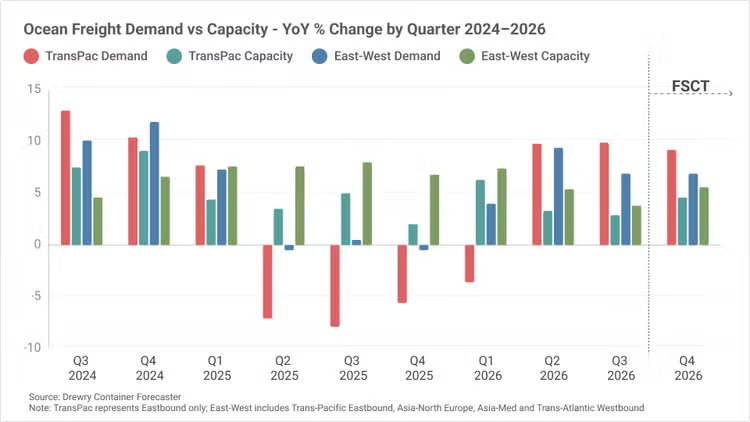
Q4 activity is forecast to improve. Demand growth exceeds capacity growth in both charted measures. Effective capacity remains constrained by schedule disruption, low idling, maintenance, and Gulf disruption. Rate trends remain trade-specific.
Ocean Freight Demand vs Capacity
Ocean Freight Demand vs Capacity
- Q4 demand is forecast to exceed capacity growth in both measures. Trans-Pacific demand is forecast at 9.2%, versus 4.6% capacity growth. Broader East–West demand is forecast at 6.9%, versus 5.6% capacity growth.1
- Drewry and JOC measure different market scopes. JOC cites Global Port Tracker’s projection that total US imports will grow at a more moderate 0.7% rate through Q4. Drewry’s chart covers broader trade demand and capacity. The forecasts are not directly comparable.1, 2
- Higher deployment has not eliminated effective-capacity constraints. Schedule reliability remains weak. Low idling, maintenance and Gulf disruption also keep tonnage out of service.2
- Available vessel supply remains tight. Commercially idle capacity represented only 0.7% of the fleet, while repair-yard activity and Gulf disruption kept additional tonnage out of revenue service.3
Sources: 1) Drewry Issue 3 2) JOC Quarterly Report 3) Alphaliner Newsletter 41-2026
Ocean Freight Rates
Ocean Freight Rates
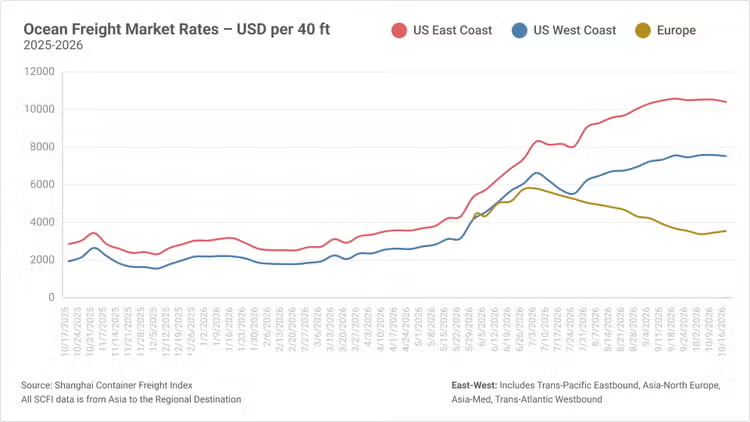
- Q4 opened with trans-Pacific rates still elevated after the September increase. JOC reported that Asia–US West Coast pricing reached its highest level since May 2022 in mid-September.2
- The updated chart shows different rate paths by trade. US East Coast and US West Coast rates remain above early-2026 levels, while Europe has eased from its Q3 peak.
- The divergence coincided with different routing and capacity conditions. Drewry reported that Shanghai–Rotterdam rates declined 29% over 11 weeks through September 24, while headhaul trans-Pacific rates increased 20%–30% during the same period.1
- Stronger Q3 spot-rate gains raised the 2026 rate outlook. Drewry revised its forecast for East–West freight rates, including fuel, from a 5.3% decline to an 18.2% increase.1
Sources: 1) Drewry Issue 3 2) JOC Quarterly Report
Ocean Freight Industry Drivers
Q4 activity is forecast to strengthen, but capacity and rate trends remain uneven by trade.
- Drewry forecasts global container activity to grow 3.4% year over year in Q4, up from 2.5% in Q3.1
- North American container activity is forecast to grow 10.6% year over year in Q4, compared with 4.0% in Q3.1
- JOC expects the early trans-Pacific peak to continue into Q4. US imports from Asia were 1.7% higher year over year through August.2
- Year-to-date import performance remains mixed by trade. US imports from North Europe and the Mediterranean declined 1.7% year over year through August.2
Implications: Forecast Q4 growth is stronger, but not broad-based. Consider confirming volume, lead time, and space by lane and departure period.
Sources: 1) Drewry Issue 3 2) JOC Quarterly Report
- Trans-Pacific deployed capacity increased 18.5% year over year in September, according to JOC.2
- Higher deployment did not offset schedule disruption. Asia–US West Coast on-time performance fell to 26% in September, while Asia–US East Coast reliability remained in the single digits.2
- Commercial idling remained very low. Alphaliner recorded 232,772 TEUs as commercially idle on October 5, equal to only 0.7% of the global fleet.3
- Other operating factors continued to absorb vessel capacity. Capacity in repair yards approached 600,000 TEUs, while approximately 130,000 TEUs remained unavailable because of the Middle East Gulf situation.3
Implications: More deployment does not guarantee reliable space. Compare schedule reliability, alternate departures and routing before confirming shipment timing.
Sources: 2) JOC Quarterly Report 3) Alphaliner Newsletter 41-2026
- Congestion improved at Shanghai and Ningbo after Golden Week. Average vessel waits fell to a little over two days.4
- The improvement was not uniform. Selected terminals continued to report higher delays or high yard utilization in Shanghai, Shekou, Singapore, Busan and Vung Tau.4
- India–Middle East cargo flows remained under pressure. JOC reported longer berthing delays at Fujairah and Khor Fakkan and tighter feeder capacity on the trade.5
- The return to Suez remained gradual. Alphaliner reported that released vessel capacity had been absorbed and had not yet caused a sudden increase in idling.3
Implications: Port conditions differ by gateway. Check congestion, equipment availability, routing options and applicable surcharges before booking.
Sources: 3) Alphaliner Newsletter 41-2026 4) JOC 5) JOC
Customs & Trade Compliance Trends
Importers must adapt to evolving tariff policies, stronger enforcement and increased audit activity.
- Increased government emphasis on customs enforcement and revenue collection is driving greater scrutiny of tariff declarations and duty payments.1
- Companies importing tariff-sensitive products continue to face pressure to validate HTS classifications, origin claims and supporting documentation used to determine duty liability.2
- CAPE Phase 3 launched Oct. 6, expanding IEEPA refund eligibility to certain finally liquidated entries for eligible plaintiffs.3
Implications: Importers should ensure strong tariff governance practices are in place, including classification reviews, origin validation and scenario planning for future duty changes.
Sources: 1) Whitehouse 2) CBP 3) USITC
- CBP has begun enhanced enforcement of Importer of Record (IOR) data accuracy, with inaccurate or incomplete CBP Form 5106 information potentially resulting in immediate voiding of IOR numbers and disruptions to import activity.4
- Executive Order 14411 directs CBP to strengthen customs enforcement through increased importer verification, enhanced transparency requirements and greater accountability for trade compliance.5
- Foreign Importers of Record (Non-Resident Importers) face heightened scrutiny as CBP evaluates additional vetting, bonding and compliance requirements to ensure importer accountability.6
Implications: Importers should review and update CBP Form 5106 records, verify importer information in ACE, maintain strong compliance controls and ensure documentation and importer structures can withstand increased CBP scrutiny.
Sources: 4) FRN 5) Whitehouse 6) CBP
- The Canada Border Services Agency (CBSA) continues to increase trade compliance verification activity, with particular focus on tariff classification (HS), country of origin, and customs valuation.7
- Importers receiving a CBSA trade compliance verification or audit notice should be prepared to provide detailed documentation supporting classification, origin and valuation determinations.
Implications: Importers should review classification, origin and valuation data and ensure documentation is audit-ready before responding to a CBSA verification request. Learn more at CBSA D-Memorandum 11-6-8.
Source: 7) CBSA
Global Logistics & Distribution Highlight
Tight capacity and rising costs strengthen the case for warehouse automation and efficient returns.
- The Logistics Manager’s Index in the US increased to 70.2 in Sept 2026, the 2nd highest since June 2026 (71.1).1
- Inventory Levels were 58.9 while Inventory Costs were 79.9.1
- Warehousing Capacity shrank to 39.3, the most since March 2022 (53.5).
- Warehousing Utilization was 64.3 while Warehousing Prices increased from 73.5 to 75.1
- Transportation Utilization surged to 92.71
Implications: Companies, particularly retailers, have run inventory down and are not rushing goods in now ahead of potential holiday sales. Logistics costs seem to be rapidly increasing no matter what the underlying situation is.
* The US Logistics Managers’ Index (LMI), published monthly by the Council of Supply Chain Management Professionals (CSCMP), tracks inventory, warehousing and transportation trends to help contract logistics providers anticipate market shifts, cost pressures and capacity constraints
Source: 1) LM
- Autonomous unloading addresses a critical labor and safety challenge. It reduces reliance on difficult-to-retain labor for one of the warehouse’s most physically demanding and unpredictable activities.2
- The technology is operationally viable today. Advances in AI, perception systems, gripping technology and lower hardware costs have made autonomous inbound automation more practical and affordable.2
- Operational fit determines success. Companies must assess freight characteristics, damaged or irregular cases, conveyor compatibility and downstream workflow requirements before deployment.2
- Automation improves throughput predictability. AU can unload up to 800 cases per hour and maintain a steady pace, helping managers plan dock activity, staffing and trailer flow more precisely.2
Implications: Autonomous unloading is now a viable strategic investment for high-volume warehouses, reducing labor and safety pressures while delivering more predictable inbound operations. With rapid deployment, throughput of up to 800 cases per hour and a stated two-to-three-year ROI at sufficient utilization, AU offers a scalable path to greater efficiency and operational resilience.
Source: 2) Boston Dynamics
- Returns are a margin issue, not just a customer-experience issue. Excess handling, receiving costs and delayed resale can quietly erode profitability.3
- Reverse logistics requires a purpose-built operating model. Returns should have dedicated processes, technology and infrastructure rather than being treated as outbound fulfillment in reverse.3
- Speed-to-resale is a critical value lever. Accelerating returned products back into sellable inventory helps address the margin impact associated with delayed resale.3
- Verification and consolidation can improve returns economics. Early item verification can reduce fraud, while consolidation can lower reverse-logistics costs.3
Implications: Happy Returns transforms returns from a margin drain into a value-recovery opportunity and can strengthen our FG and SPL Network through verification, consolidation and faster inventory recovery. It can also improve returns economics by reducing fraud exposure and consolidation costs while accelerating products back to sellable inventory.
Source: 3) The Modern Supply Chain
Regional Perspectives
Insights gathered from regional teams to provide a broader perspective on evolving market trends, customer priorities and industry developments across key geographies.
- Container traffic through Suez continues to recover, reaching 753,000 TEU of weekly capacity in early October, over half of comparable 2023 levels. Further normalization could increase effective capacity and support softer Asia–Europe rates through Q4.1
- The EU Customs Reform entered into force in September and begins a broader transition toward a digital, data-driven customs environment. More immediately for Q4, the European Commission confirms that a new €2 Union handling fee takes effect from 1 November 2026, on top of the temporary €3 customs duty introduced for low-value consignments in July.2
- EU diesel prices reached a record €2.26/L in September, +38% since February. With IRU expecting diesel markets to remain undersupplied, elevated fuel costs remain a key Q4 risk for European road transport.3
Implications: Improved Suez connectivity could increase ocean capacity and ease Asia–Europe freight rates. However, rising diesel prices could keep European road freight costs elevated, with carriers facing higher operating costs and potential fuel surcharges. At the same time, new EU customs charges add further cost and complexity to eCommerce logistics.
Sources: 1) Container News 2) European Commission 3) IRU
- Market Trend | LATAM trade is gaining momentum: Goods exports are expected to grow 20% in 2026, supported by a 9% increase in volumes, with Mexico showing particular strength in manufactured exports.1
- Industry Development | Supply chains are being reshaped by shifting trade patterns: Nearshoring continues to influence Mexico and Central America, while companies reassess sourcing, manufacturing, warehousing and transportation networks as trade flows evolve.2
- Customer Priority | Digital transformation is moving to the top of the agenda: 34% of LATAM organizations identify digital transformation as their main internal challenge, with technology, automation and AI increasingly central to companies' efficiency and growth priorities.3
Implications: Strong trade growth and shifting supply-chain footprints are increasing logistics complexity across LATAM, driving customers to prioritize digitalization, automation and greater end-to-end visibility to build more agile and resilient supply chains.
Sources: 1) Cepal 2) Americas Market Intelligence 3) EY
- Singapore’s Tuas Port is being developed as a major integrated trade and logistics hub, combining large-scale capacity expansion with automation, digitalization and sustainability. The port has handled more than 25 million TEUs since operations began in September 2022, with 14 berths currently operational and 18 expected by 2027. When fully developed in the 2040s, Tuas Port is planned to reach a total handling capacity of 65 million TEUs.1
- China’s Pinglu Canal opened in September 2026, establishing a new connection between inland southwest China and the Beibu Gulf. The corridor provides a shorter route to the sea for selected cargo flows and strengthens connectivity between western China and ASEAN markets. This creates opportunities to develop freight flows and support customers seeking more efficient routing options.2
Implications: Port expansion, technology exports and new trade corridors are strengthening Asia’s logistics connectivity, supporting greater freight flows and supply-chain diversification. This could create further opportunities for air and ocean freight, multimodal solutions and cross-border logistics, while giving companies more flexibility to optimize routing and build resilient regional supply chains.
Sources: 1) Global PSA 2) Asia Cargo News
More From UPS Supply Chain Solutions

UPS Freight Services
At UPS SCS, we’re here to simplify shipping freight. Find the freight service that’s right for you and get your freight moving in the UPS Forwarding Hub.

Get Tariff Support
Stay informed on the most recent US tariff developments and potential impacts to global trade and supply chains

Ask an Expert
Questions? We’ll connect you to people with answers. Tell us about you, and choose a topic to get started.